

📈📉 BTC Death Cross Unavoidable + SOL to $16?
📈📉 BTC Death Cross Unavoidable + SOL to $16?

Overview
Chart #1 - Ethereum (ETHUSDT) Daily Chart
Chart #2 - U.S. Dollar (DXY) Daily Chart
Chart #3 - Bitcoin (BTCUSD) Daily Chart
Chart #4 - Solana (SOLUSDT) 12-Hour Chart
Chart #5 - Fear and Greed Index

Chart #1 - Ethereum (ETHUSDT) Daily Chart
Chartist: Sheldon
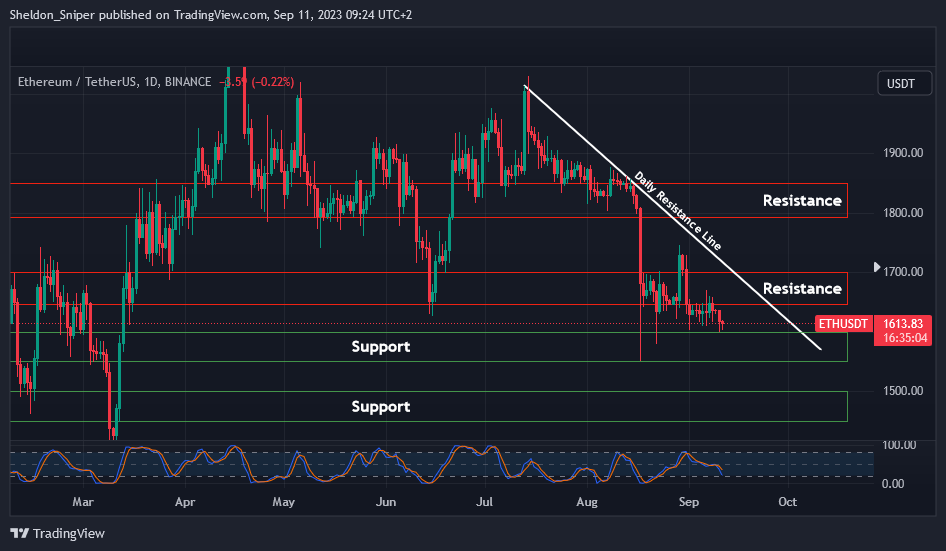
(For the chart screenshot, click here.)
If ETH’s $1,600 support fails to hold and the price continues its downward trend, the subsequent support stands at a low of $1,550.
Should that level be breached, the next support zone is between $1,450 - $1,500, a range last revisited in March.
The altcoin market appears to be weakening while BTC remains stagnant. I believe that only when BTC shows a definitive upward trend will we witness a corresponding move in ETH.
𝗣𝗿𝗶𝗺𝗲 𝗫𝗕𝗧
Sign up for a new Trading Account on Prime XBT!
Receive a deposit bonus of up to $7,000 with promo code: SheldonSniper
Sign-up and trade on Bybit today.
Exclusive $30,000 deposit rewards and bonuses up for grabs!
Chart #2 - U.S. Dollar (DXY) Daily Chart
Chartist: Kyle
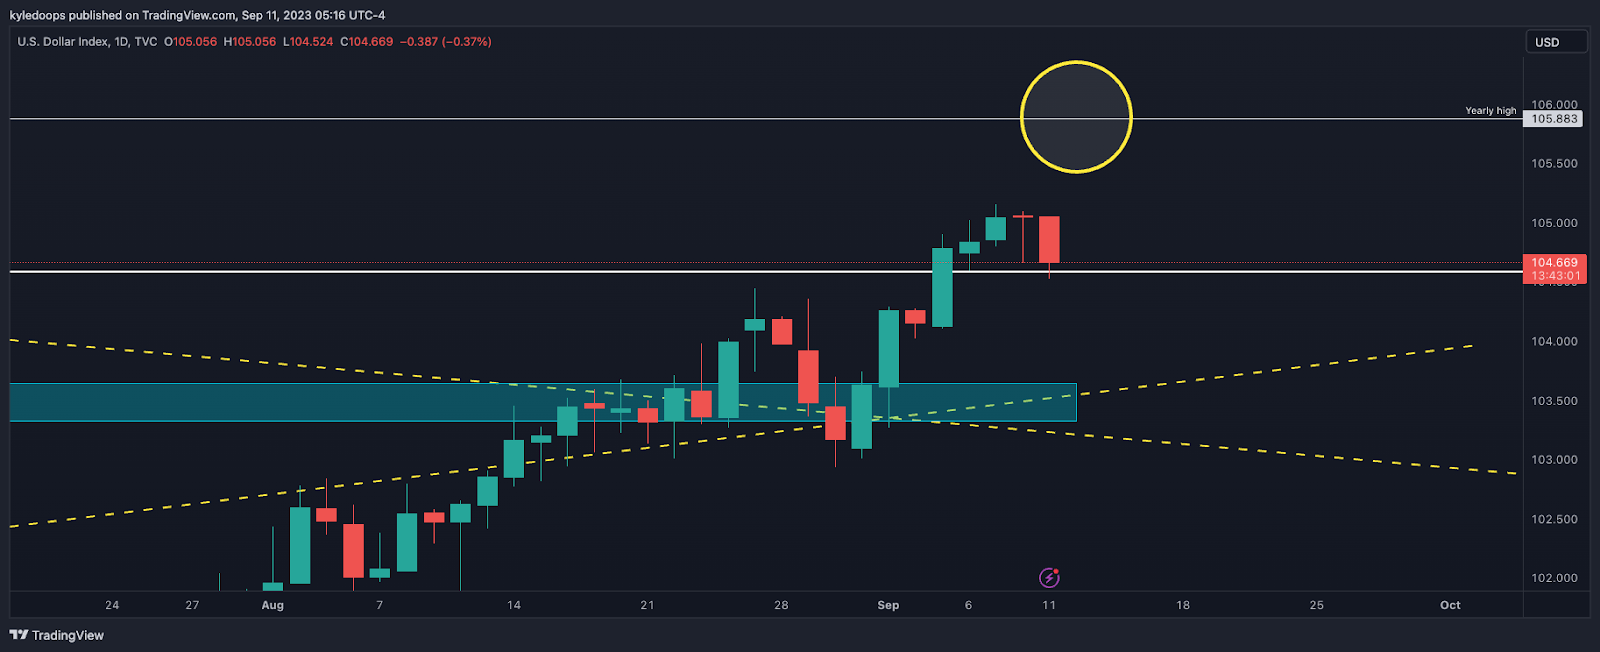
(For the chart screenshot, click here.)
The DXY displayed signs of vulnerability based on last week's candle close, which was a hanging man reversal candlestick.
If this week's candle closes below the low of the previous week's candle, the DXY might trigger a downward momentum, potentially allowing Bitcoin to establish its next higher low.
This upcoming higher low for Bitcoin is crucial, with bulls keenly aiming to uphold that level.
𝗣𝗿𝗶𝗺𝗲 𝗫𝗕𝗧
Sign up for a new Trading Account on Prime XBT!
Receive a deposit bonus of up to $7,000 with promo code: KyleDoops
Chart #3 - Bitcoin (BTCUSD) Daily Chart
Chartist: Kyle
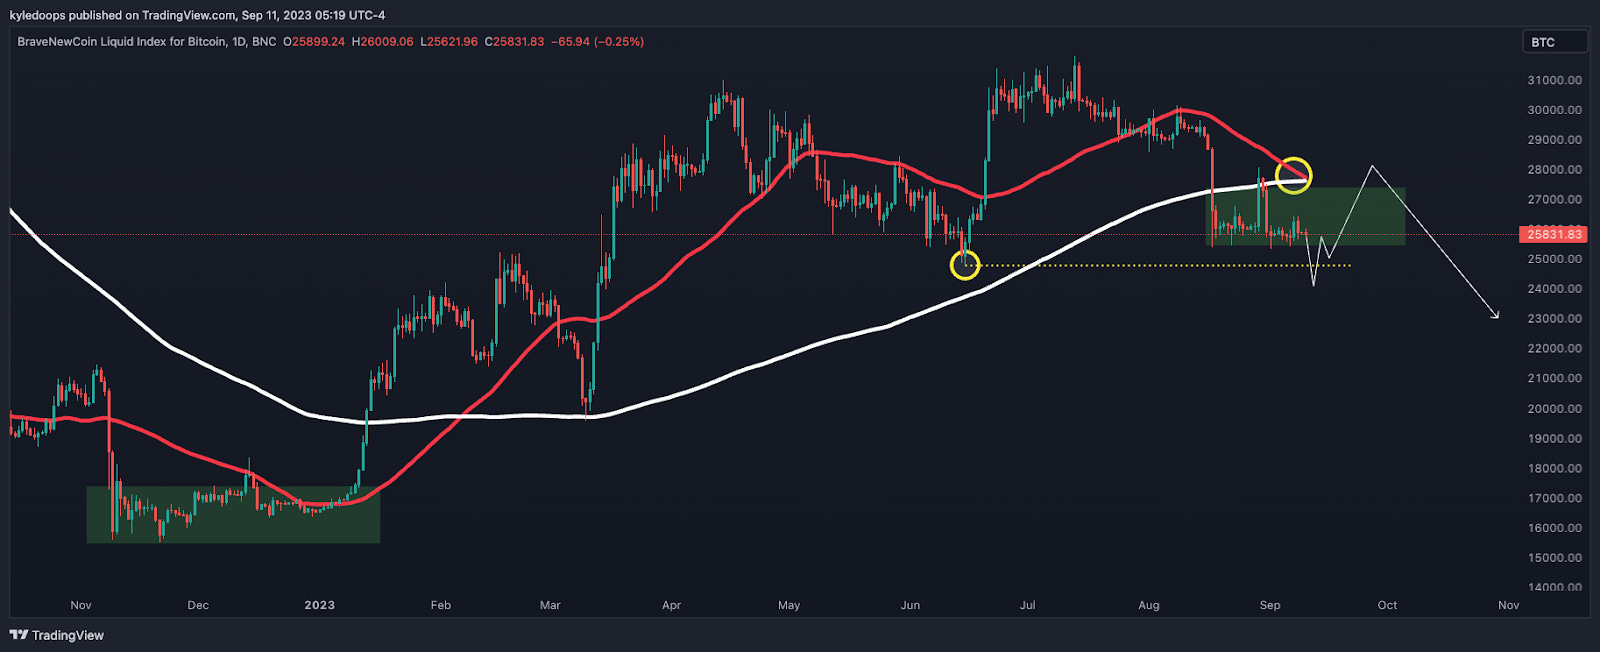
(For the chart screenshot, click here.)
The impending death cross between the 50MA and 200MA seems unavoidable, yet it doesn't automatically spell doom.
The price is expected to rally towards the death cross eventually, and its response to the 200MA (white line) will be revealing. A rejection would signal trouble, while a reclaim would be positive, potentially indicating a significant bear trap.
The current price behavior resembles the green highlighted lows from November - January, so market participants should watch for a similar pattern to develop.
Claim your Bitget sign-up bonuses here (details below).
Chart #4 - Solana (SOLUSDT) 12-Hour Chart
Chartist: Sheldon
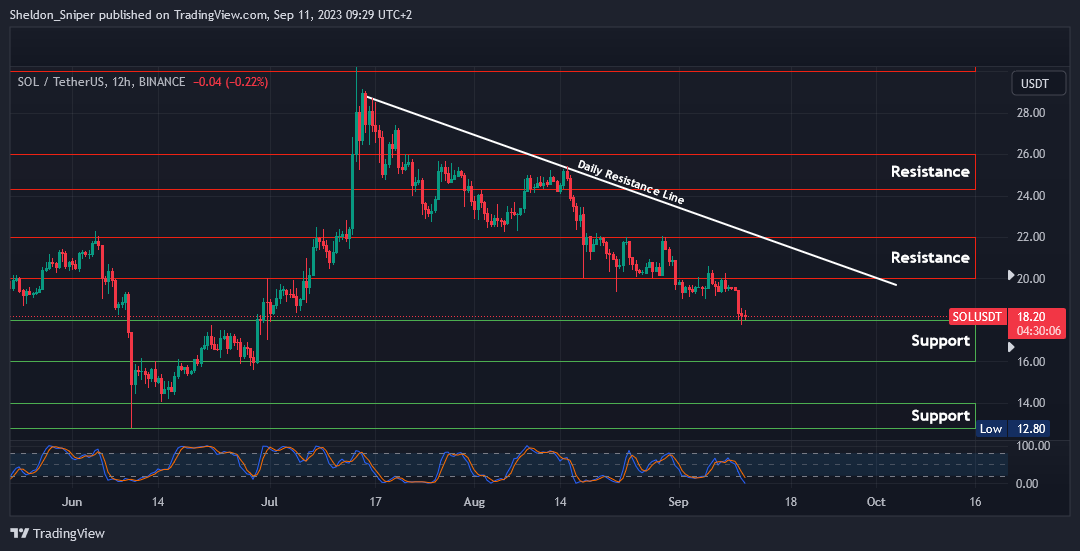
(For the chart screenshot, click here.)
SOL has been under pressure over the last few days due to news about FTX dumping SOL onto the market - an overreaction, given that the sale of the SOL tokens could spread over an extended period.
SOL is currently at $18.20, having touched the $16.00 - $18.00 support zone. If this area maintains its support, then there's potential for a move up to $20.00 - $22.00.
If $18.00 doesn't hold, SOL could descend to the lower end of the range, at $16.00.
Claim your Bitget sign-up bonuses here (details below).
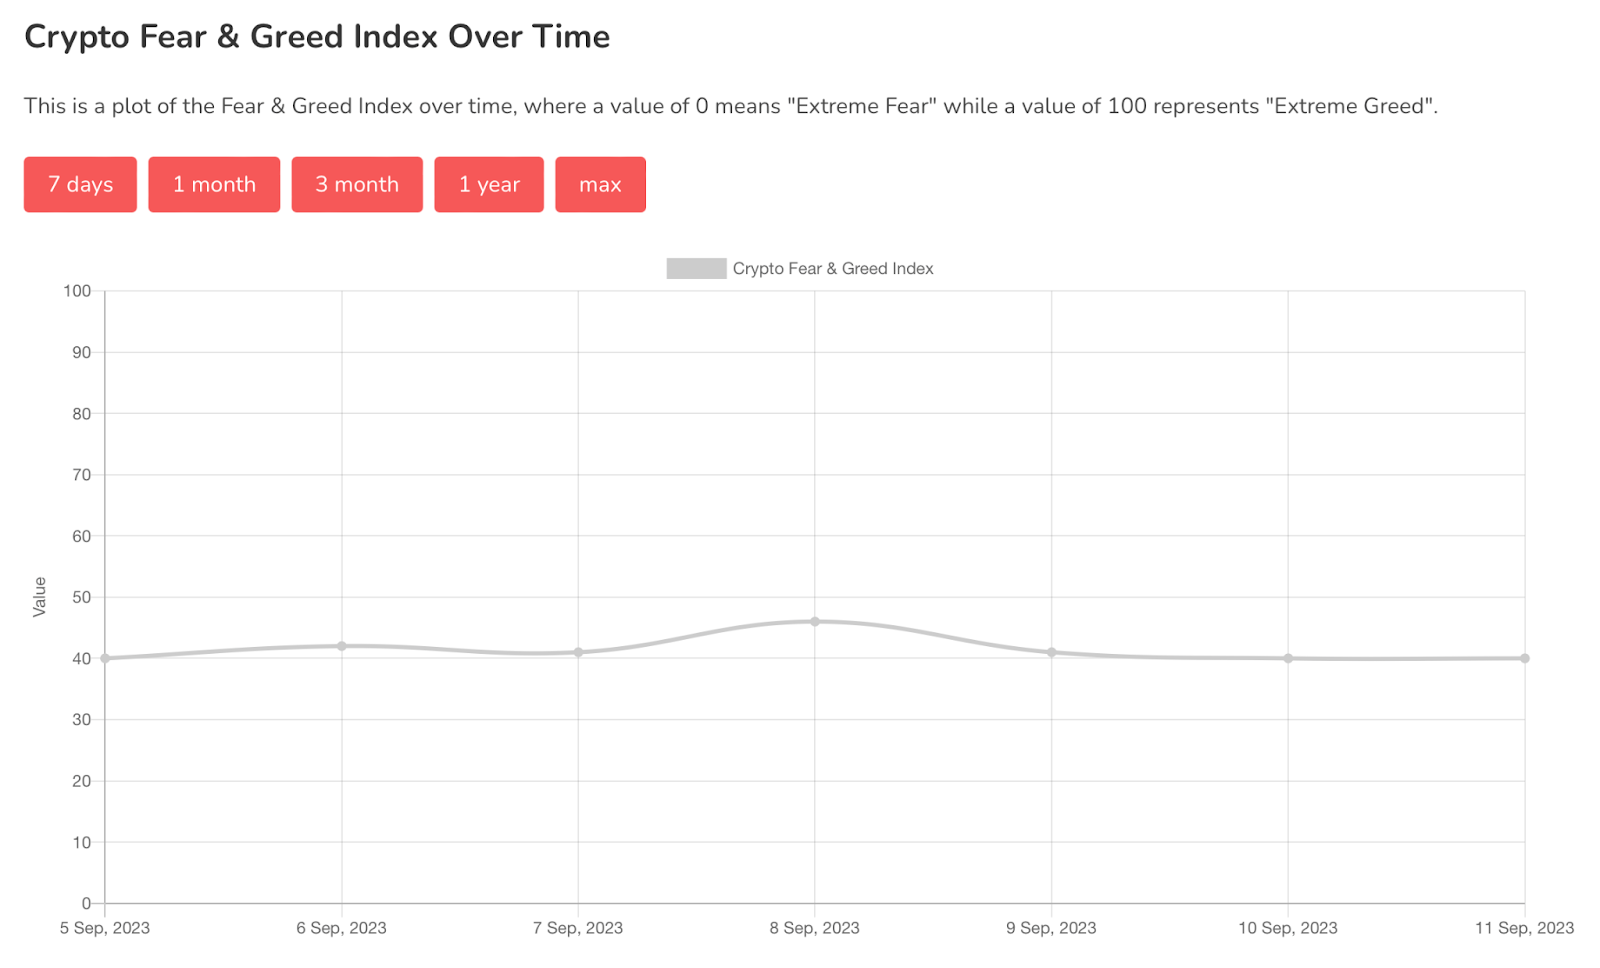
Chart #5 - Fear and Greed Index
The Fear and Greed Index is sitting at 40 today, indicating Fear.
The highest the index has been over the past seven days is 46, and the lowest is 40.
Banter’s Take
Price action remains predominantly bearish, but if bulls weather this week, momentum may tilt in their favor, putting bears on the defensive. It's the bears' prime opportunity to push prices through key support levels.
Anticipate numerous traps in the upcoming days, affecting both bulls and bears.
Stay safe my friends!
Go to our Crypto Banter Discord here where Sheldon and Kyle give updates on the charts and trades from The Daily Candle newsletter!