

📈📉 BTC Forms Bullish Pennant! $38k NEXT?
📈📉 BTC Forms Bullish Pennant! $38k NEXT?
PLUS - SOL/BTC: A Lot is at Stake!
Overview
Chart #1 - Bitcoin Dominance (BTC.D) Weekly
Chart #2 - Bitcoin (BTCUSD) 4-Hour
Chart #3 - Solana to Bitcoin Ratio (SOLBTC) Daily
Chart #4 - Solana (SOLUSDT) Daily
Chart #5 - Fear and Greed Index

Chart #1 - Bitcoin Dominance (BTC.D) Weekly
Chartist: Sheldon
(For the chart screenshot, click here.)
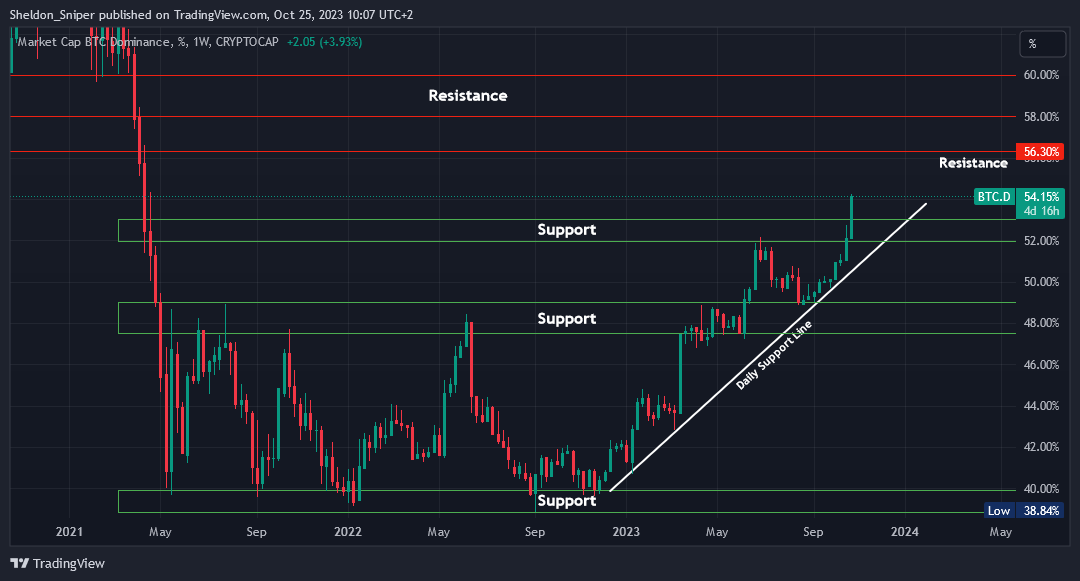
This week, we saw Bitcoin Dominance break out of the 53% range high level of resistance.
This is after BTC broke through the $31,800 resistance level and went all the way up to around $35,000. If there is a pullback in BTC Dominance, the 52% - 53% area will now act as support. Any pullback will give further relief to the alts.
BTC.D is currently at just over 54%. If it continues its trend to the upside, the next resistance level is around 56.3%, with the next major area of resistance at 58% - 60%.
Sign-up and trade on Bybit today.
Exclusive $30,000 deposit rewards and bonuses up for grabs!
Chart #2 - Bitcoin (BTCUSD) 4-Hour
Chartist: Kyle

(For the chart screenshot, click here.)
Bitcoin is currently in a bullish pennant following its recent significant upward movement.
These formations often break to the upside, and if history serves as a guide, Bitcoin could be targeting $38,456.
At that price point, it would be significantly overextended from the EMAs, suggesting a major correction might follow shortly thereafter.
Claim your Bitget sign-up bonuses here (details below).
Chart #3 - Solana to Bitcoin Ratio (SOLBTC) Daily
Chartist: Kyle

(For the chart screenshot, click here.)
SOL/BTC has backtested the mid-range support and the downtrending line from which it recently broke out.
This backtest could signal a bump and run scenario leading to the 0.00119 level. If it fails to maintain this mid-range and the bump and run pattern, then we might witness a major bull trap, potentially retracing back down to 0.0004.
Thus, a lot is at stake.
Claim your Bitget sign-up bonuses here (details below).
Chart #4 - Solana (SOLUSDT) Daily
Chartist: Sheldon
(For the chart screenshot, click here.)
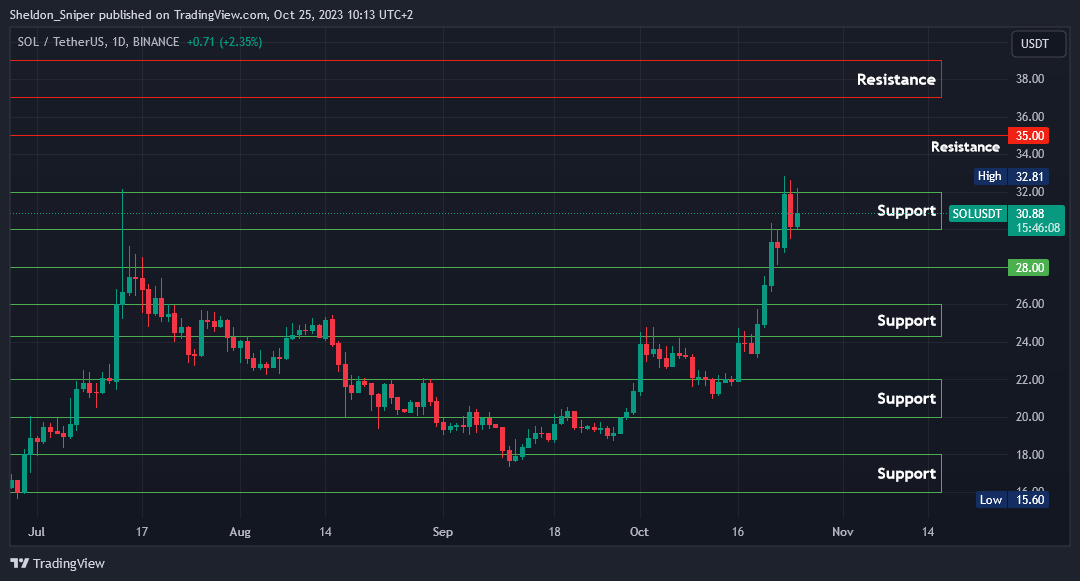
Over the last three days, SOL has been trading in a tight range between support at $30.00 and resistance at $32.00.
The Solana Conference starts on the 30th of October, and with these types of events, the price usually runs up just before the event and then sells off. I am therefore expecting another push higher with the price of SOL possibly testing $35.00, or even the next area of resistance at $37.00 - $39.00.
Traders should be aware that there might be a sharp sell-off in price leading up to the event, so there's increased risk over the next week. I would set tight stop losses. If SOL declines from here, the next support level is at $28, with the major support area below that ranging from $24.00 - $26.00.
Claim your Bitget sign-up bonuses here (details below).
Chart #5 - Fear and Greed Index
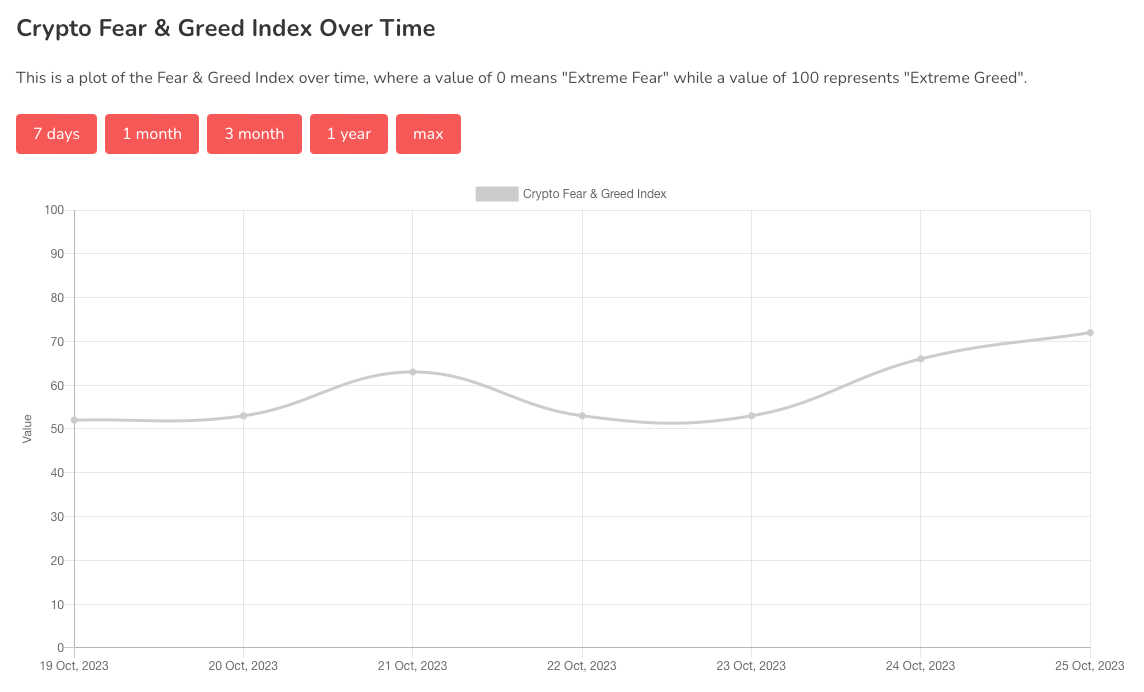
The Fear and Greed Index is sitting at 72 today, indicating Greed.
The highest the index has been over the past seven days is 72, and the lowest is 52.
Banter’s Take
Bitcoin is currently forming a bull pennant and may breakout soon. Bitcoin will most likely outperform most altcoins in the short term.
Stay safe my friends!
Go to our Crypto Banter Discord here where Sheldon and Kyle give updates on the charts and trades from The Daily Candle newsletter!