

📈📉 BTC Going Lower? + DXY at Critical Level!
📈📉 BTC Going Lower? + DXY at Critical Level!

Overview
Chart #1 - Ethereum (ETHUSDT) Daily Chart
Chart #2 - Bitcoin (BTCUSD) Daily Chart
Chart #3 - U.S. Dollar (DXY) Daily Chart
Chart #4 - Bitcoin Dominance (BTC.D) Weekly Chart
Chart #5 - Fear and Greed Index

Chart #1 - Ethereum (ETHUSDT) Daily Chart
Chartist: Sheldon
(For the chart screenshot, click here.)
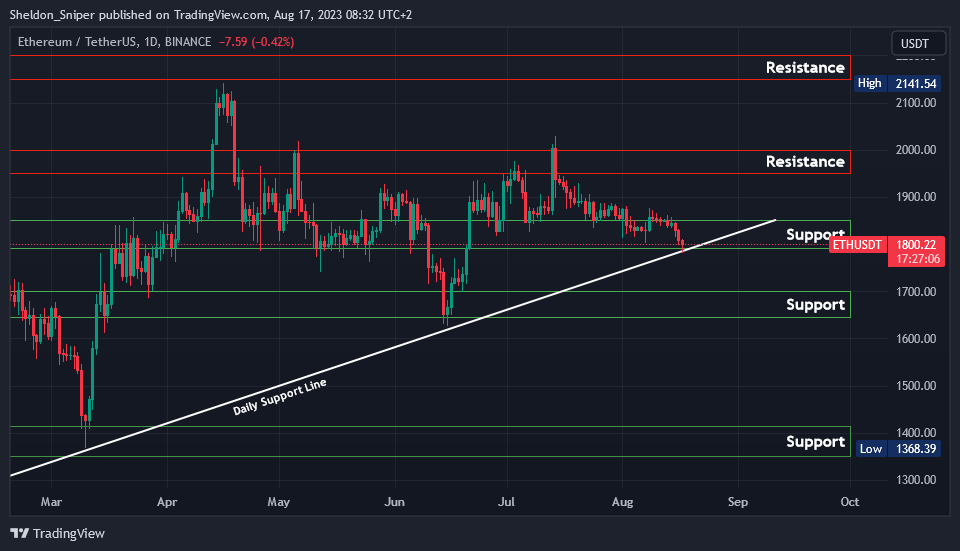
ETH is trading at $1,800, in the $1,800 - $1,850 area of support but also finds extra support from the ascending support line that began in January.
Both the U.S. stock markets and BTC are starting to show signs of weakness. If both these support levels for ETH are breached, it could be detrimental, sending ETH to $1,650 - $1,700, or even as low as $1,350 - $1,400, an area last tested in March this year.
Should the price of ETH recover from here and surpass $1,850, the next resistance level stands at $1,900, with a major resistance zone between $1,950 - $2,000 following that.
Sign-up and trade on Bybit today.
Exclusive $30,000 deposit rewards and bonuses up for grabs!
Chart #2 - Bitcoin (BTCUSD) Daily Chart
Chartist: Kyle
(For the chart screenshot, click here.)
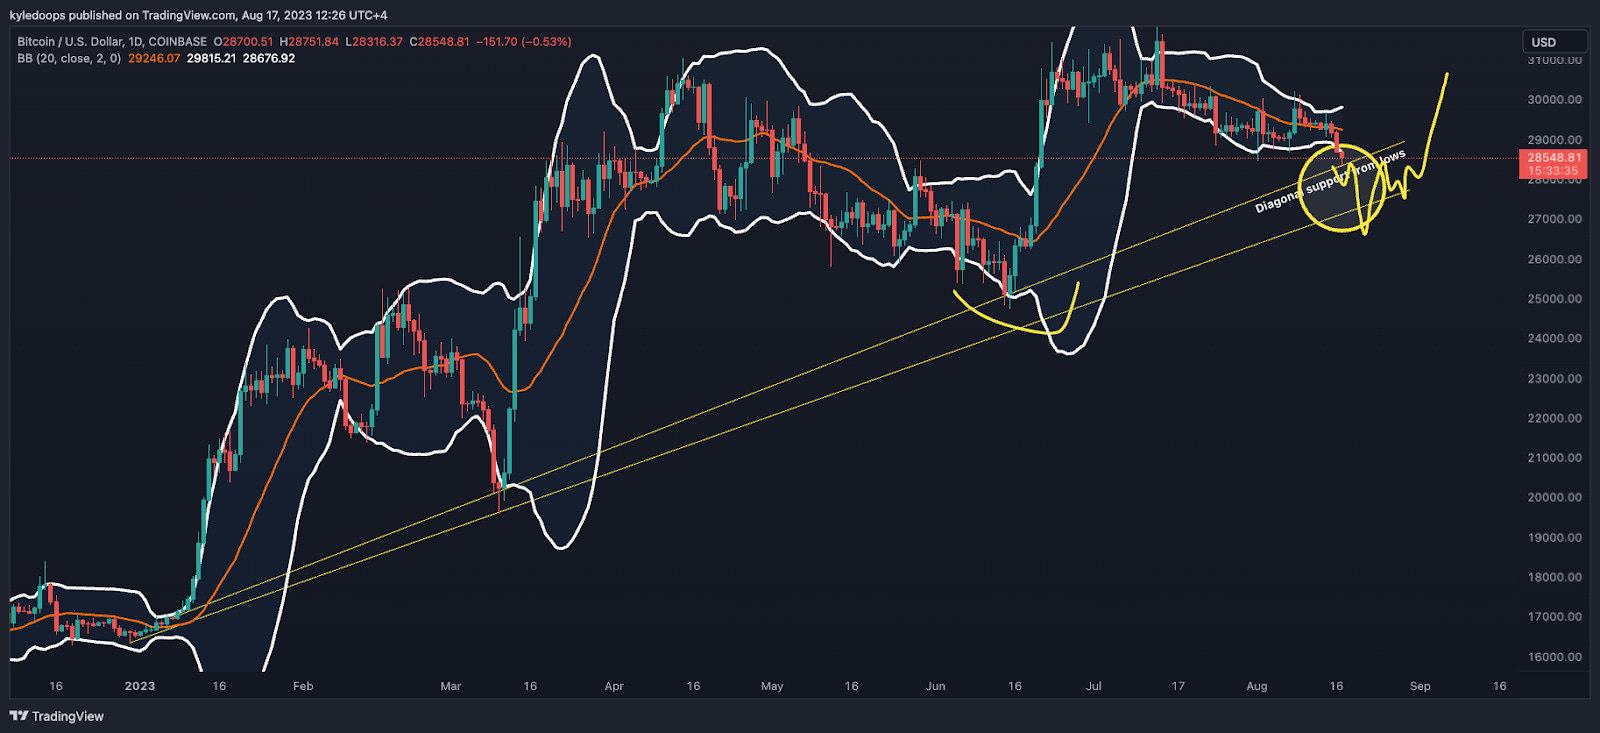
Bitcoin has begun to exhibit signs of volatility expansion and has now reached its first trend line support. If this is breached, a secondary support stands at $27,300.
According to the yellow drawings, be aware that the price might approach the lows of the secondary trend line, potentially inducing further market fear, before pivoting upward and reclaiming its position. This means that a bear trap could very well materialize in this scenario.
If BTC starts closing daily candles below this $28,500 level, there could be trouble around the corner and lower prices become possible.
𝗣𝗿𝗶𝗺𝗲 𝗫𝗕𝗧
Sign up for a new Trading Account on Prime XBT!
Receive a deposit bonus of up to $7,000 with promo code: KyleDoops
Chart #3 - U.S. Dollar (DXY) Daily Chart
Chartist: Kyle
(For the chart screenshot, click here.)
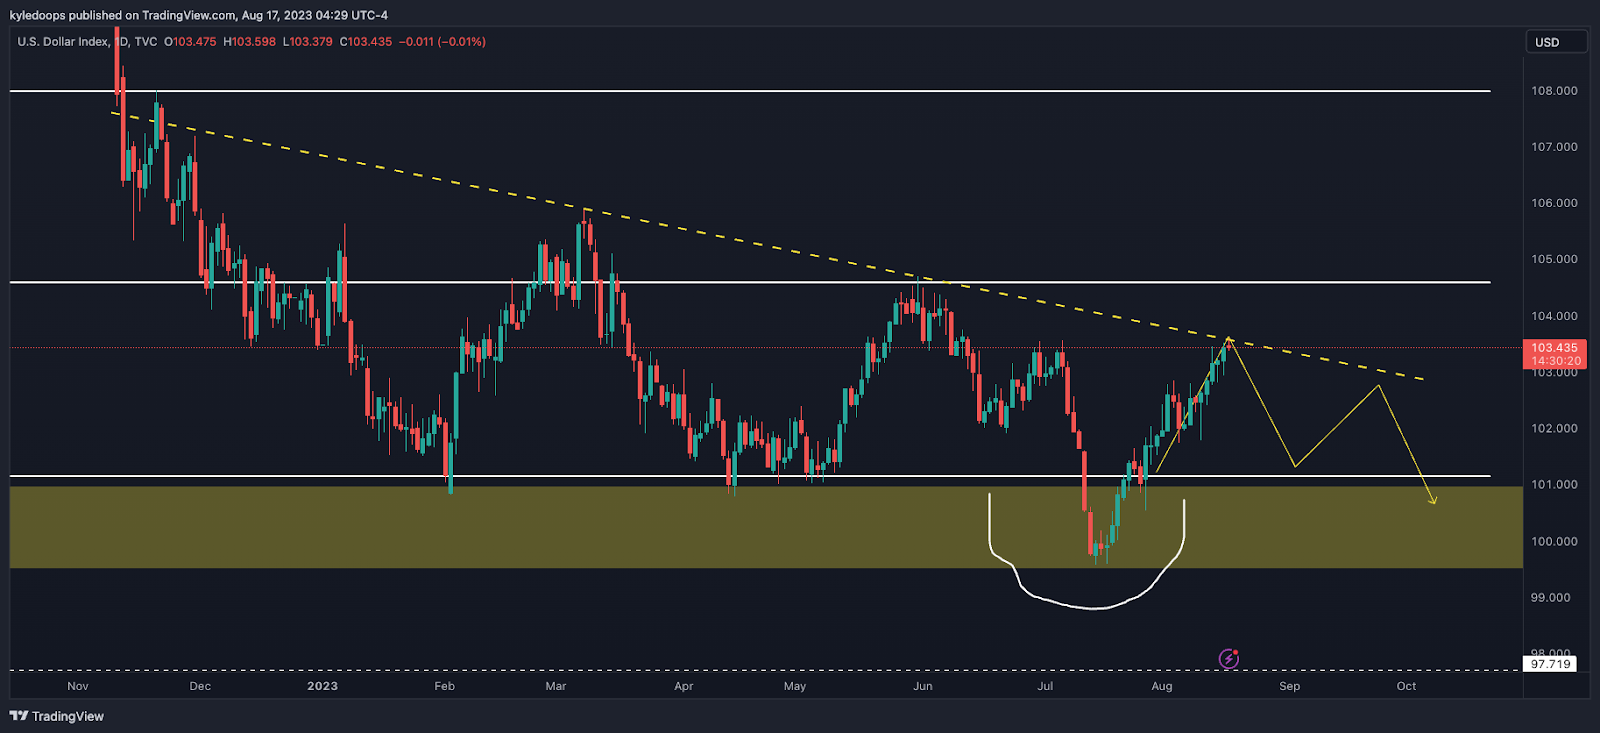
The DXY is pressing perfectly into the down sloping resistance trend line. A big question is if this is a downtrend or a range.
If it's a downtrend, we would expect a clean rejection here.
If it's a range, then we’d be looking for a clean break above this down sloping trend line and a further move up to the mid-level at 104.63.
Generally, the DXY going up applies downward pressure to BTC, and the DXY going down brings upward pressure for it.
Claim your Bitget sign-up bonuses here (details below).
Chart #4 - Bitcoin Dominance (BTC.D) Weekly Chart
Chartist: Sheldon
(For the chart screenshot, click here.)
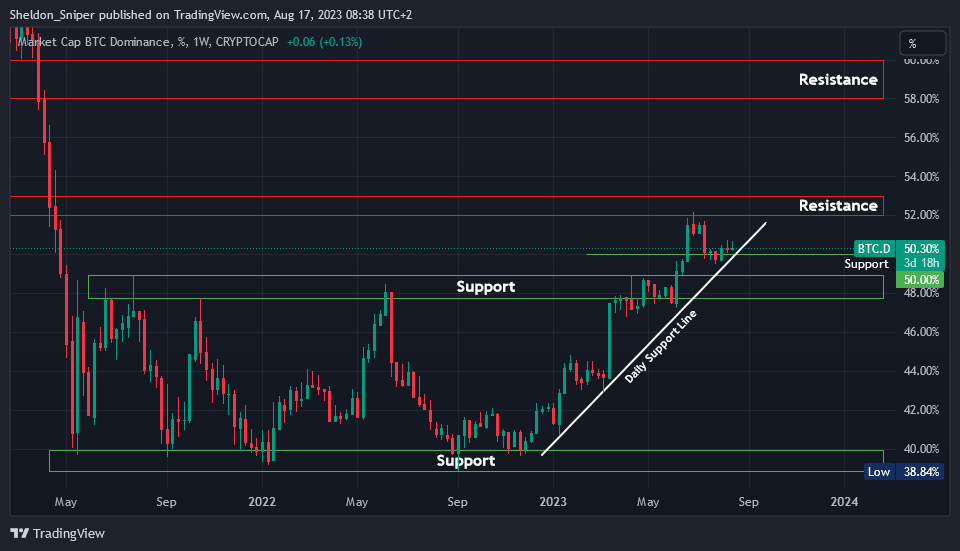
After trading in a range between 39% - 49% over the last two years, the BTC.D managed to break out of the 49% range's high resistance in June. BTC.D then progressed to the 52% area before being rejected and retracing to its current position, around 50%.
The alts continues to bleed in price compared to BTC, which remains relatively strong. This action is bullish for BTC dominance, and with the potential of a retrace in the next few months, BTC.D should continue to climb.
The next resistance is between 52% - 53%, with a significant level higher up at 58% - 60%.
If the BTC.D retraces from this point and breaches both the 50% mark and the daily ascending support line from the beginning of the year, the next support would be at 48% - 49%.
Claim your Bitget sign-up bonuses here (details below).
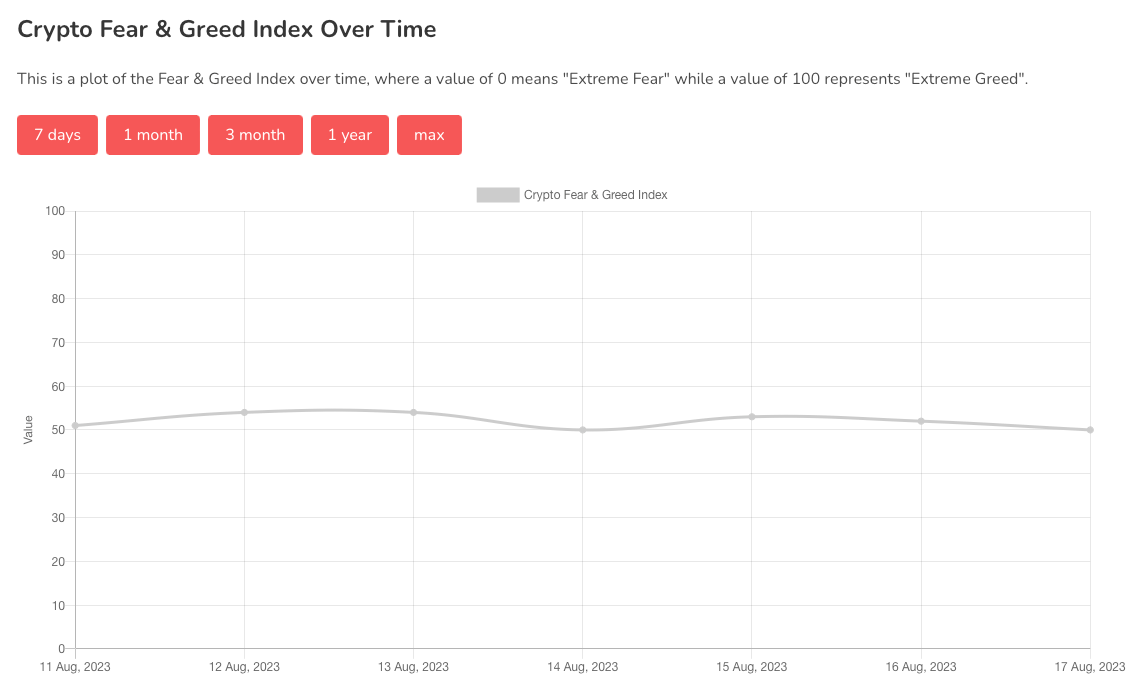
Chart #5 - Fear and Greed Index
The Fear and Greed Index is sitting at 50 today, Neutral.
The highest the index has been over the past seven days is 54, and the lowest is 50.
Banter’s Take
The market is beginning to exhibit signs of expansion, with the bears currently holding the reins.
For the bulls to regain control, they must counteract promptly to defend these positions. Otherwise, the bears may likely drive the price to even lower levels.
Stay safe my friends!
Go to our Crypto Banter Discord here where Sheldon and Kyle give updates on the charts and trades from The Daily Candle newsletter!