

📈📉 BTC Heading Below $24k? + BNB Trade Update
📈📉 BTC Heading Below $24k? + BNB Trade Update

Overview
Chart #1 - Crypto Total Market Cap (TOTAL) Daily Chart
Chart #2 - BNB (BNBUSDT) Daily Chart
Chart #3 - Bitcoin (BTCUSD) Daily Chart
Chart #4 - Fantom (FTMUSDT) Daily Chart
Chart #5 - Fear and Greed Index

Chart #1 - Crypto Total Market Cap (TOTAL) Daily Chart
Chartist: Sheldon
(For the chart screenshot, click here.)
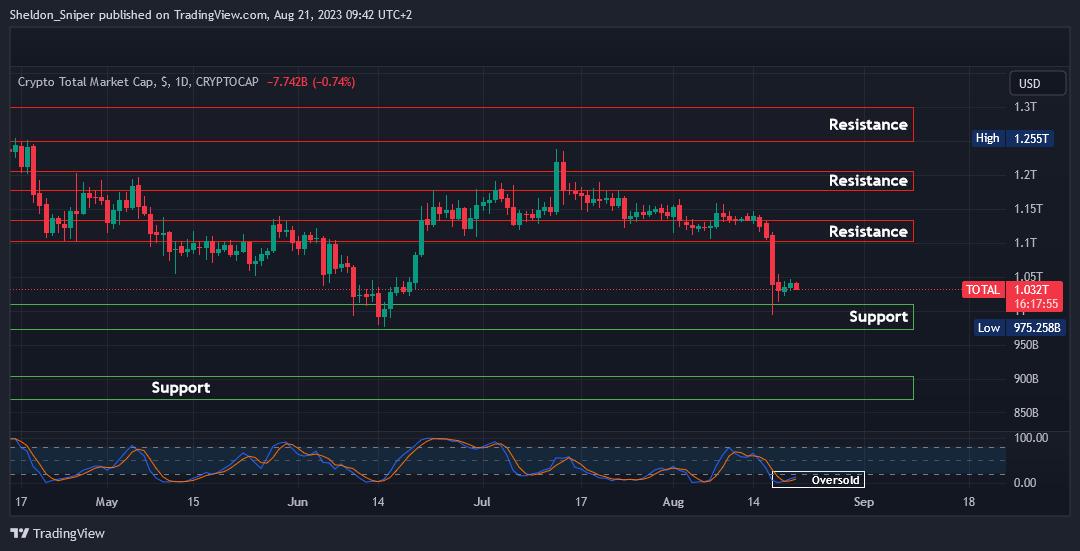
The TOTAL is currently at $1.03T and is also oversold on the daily time frame.
I am expecting it to possibly first retest last week’s low, around $975B - $1.05T, before moving up to retest the next area of resistance at $1.1T - $1.13T.
If the current $975B - $1.05T area of support is lost, then the next area of support is at $875B - $900B.
Sign-up and trade on Bybit today.
Exclusive $30,000 deposit rewards and bonuses up for grabs!
Chart #2 - BNB (BNBUSDT) Daily Chart
Chartist: Kyle

(For the chart screenshot, click here.)
Here’s an update on our given short trade.
We've compounded two shorts for this BNB trade, and have now adjusted our stops to break even. If the market is currently in a bearish expansive phase, we'd expect a swift continuation from this juncture.
Our final take profit target stands at $133, which is still 36% below the current price action.
𝗣𝗿𝗶𝗺𝗲 𝗫𝗕𝗧
Sign up for a new Trading Account on Prime XBT!
Receive a deposit bonus of up to $7,000 with promo code: KyleDoops
Chart #3 - Bitcoin (BTCUSD) Daily Chart
Chartist: Kyle
(For the chart screenshot, click here.)
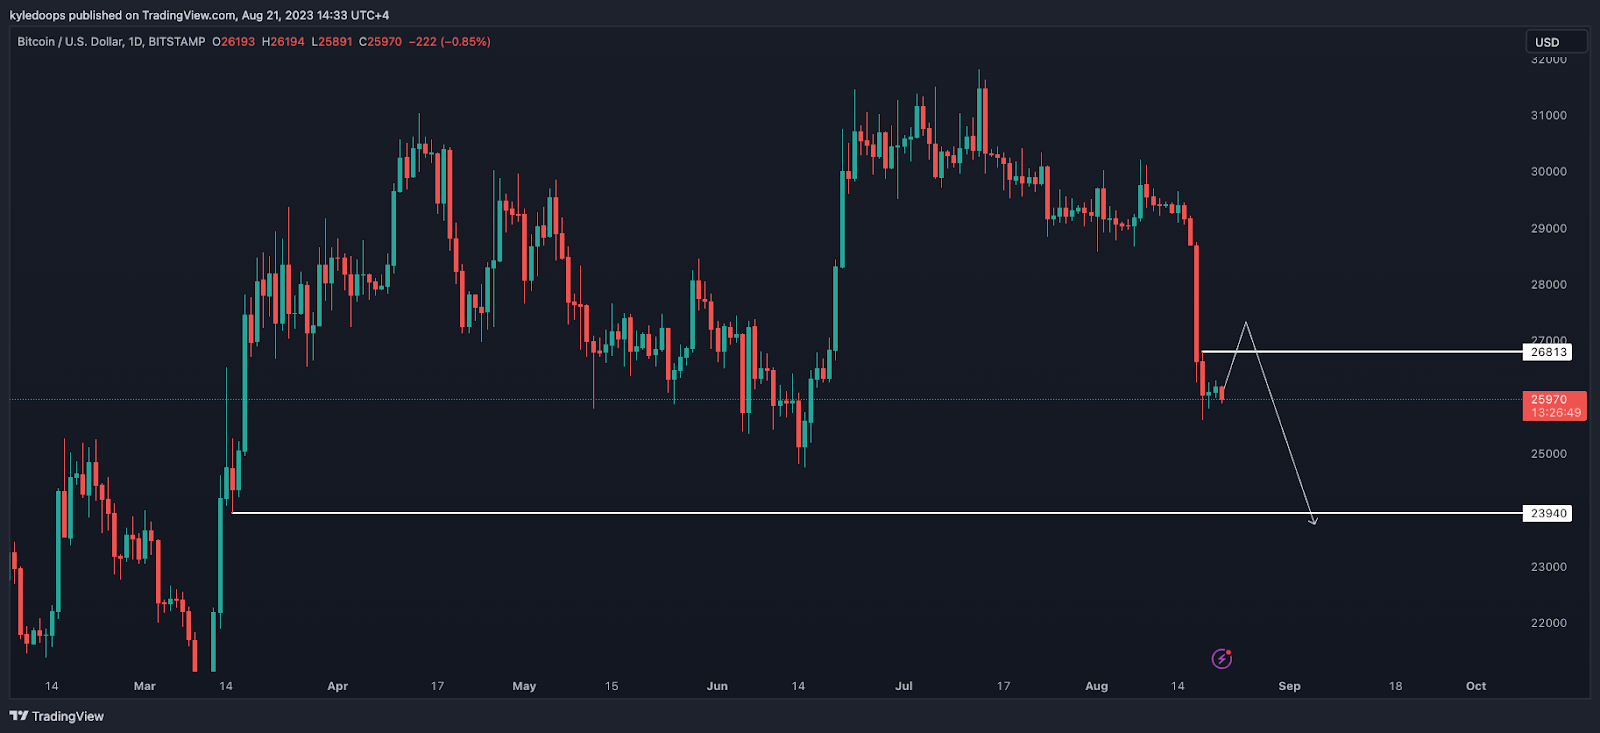
To keep things simple, I'm watching for a sweep above the $26,813 level. This is likely targeting short sellers' orders, causing the price to descend and sweep the untouched liquidity at $23,940.
Claim your Bitget sign-up bonuses here (details below).
Chart #4 - Fantom (FTMUSDT) Daily Chart
Chartist: Sheldon
(For the chart screenshot, click here.)
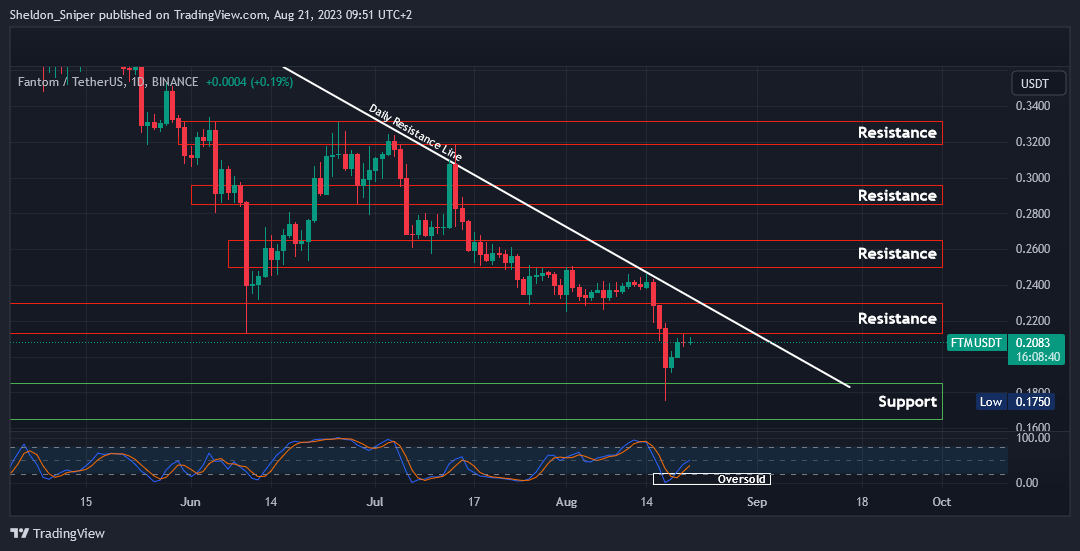
During last week's massive drop, FTM dropped to $0.1750 .
The $0.1650 - $0.1850 range managed to hold as support before recovering to its current trading point, almost $0.21. There might be a retrace from this point to test the $0.1850 area, creating a higher low in the process, before a potential upward move.
If the price can surpass both the $0.21 - $0.23 resistance area and the daily descending resistance line originating from May, situated around $0.22, then the next resistance zone to watch is $0.25 - $0.265.
I anticipate a relief bounce to occur soon.
Claim your Bitget sign-up bonuses here (details below).
Chart #5 - Fear and Greed Index
The Fear and Greed Index is sitting at 38 today, indicating Fear.
The highest the index has been over the past seven days is 53, and the lowest is 37.

Banter’s Take
Bitcoin's weekly close was notably bearish, signaling a potential continued decline. Losing key high-timeframe support levels and crucial moving averages was unfavorable.
Stay safe my friends!
Go to our Crypto Banter Discord here where Sheldon and Kyle give updates on the charts and trades from The Daily Candle newsletter!