

📈📉 BTC Heading to $23,500? + Gold Short Trade Setup
📈📉 BTC Heading to $23,500? + Gold Short Trade Setup

Overview
Chart #1 - Solana (SOLUSDT) Daily Chart
Chart #2 - Bitcoin (BTCUSD) Daily Chart
Chart #3 - Gold (XAUUSD) Hourly Chart
Chart #4 - Polygon (MATICUSDT) Daily Chart
Chart #5 - Fear and Greed Index

Chart #1 - Solana (SOLUSDT) Daily Chart
Chartist: Sheldon
(For the chart screenshot, click here.)
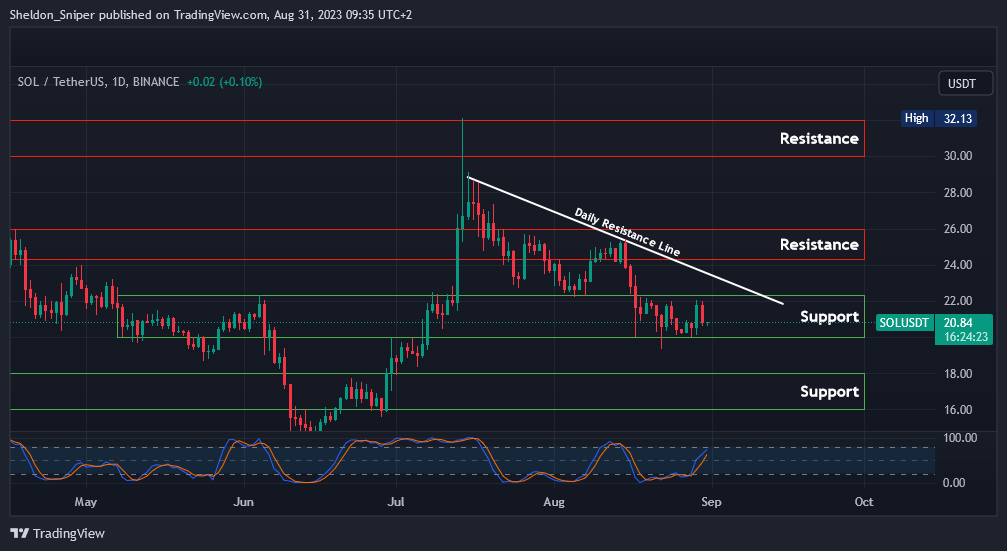
Over the last two weeks, the price of SOL has been ranging between a $20.50 low support and a $22.00 range high.
If the market can continue its trend to the upside, and at the same time SOL can break through the $22.00 range high resistance, it should head to $23.00.
But, if SOL loses the $20.50 level of support, the next area of support comes in at $16.00 - $18.00.
𝗣𝗿𝗶𝗺𝗲 𝗫𝗕𝗧
Sign up for a new Trading Account on Prime XBT!
Receive a deposit bonus of up to $7,000 with promo code: SheldonSniper
Sign-up and trade on Bybit today.
Exclusive $30,000 deposit rewards and bonuses up for grabs!
Chart #2 - Bitcoin (BTCUSD) Daily Chart
Chartist: Kyle
(For the chart screenshot, click here.)
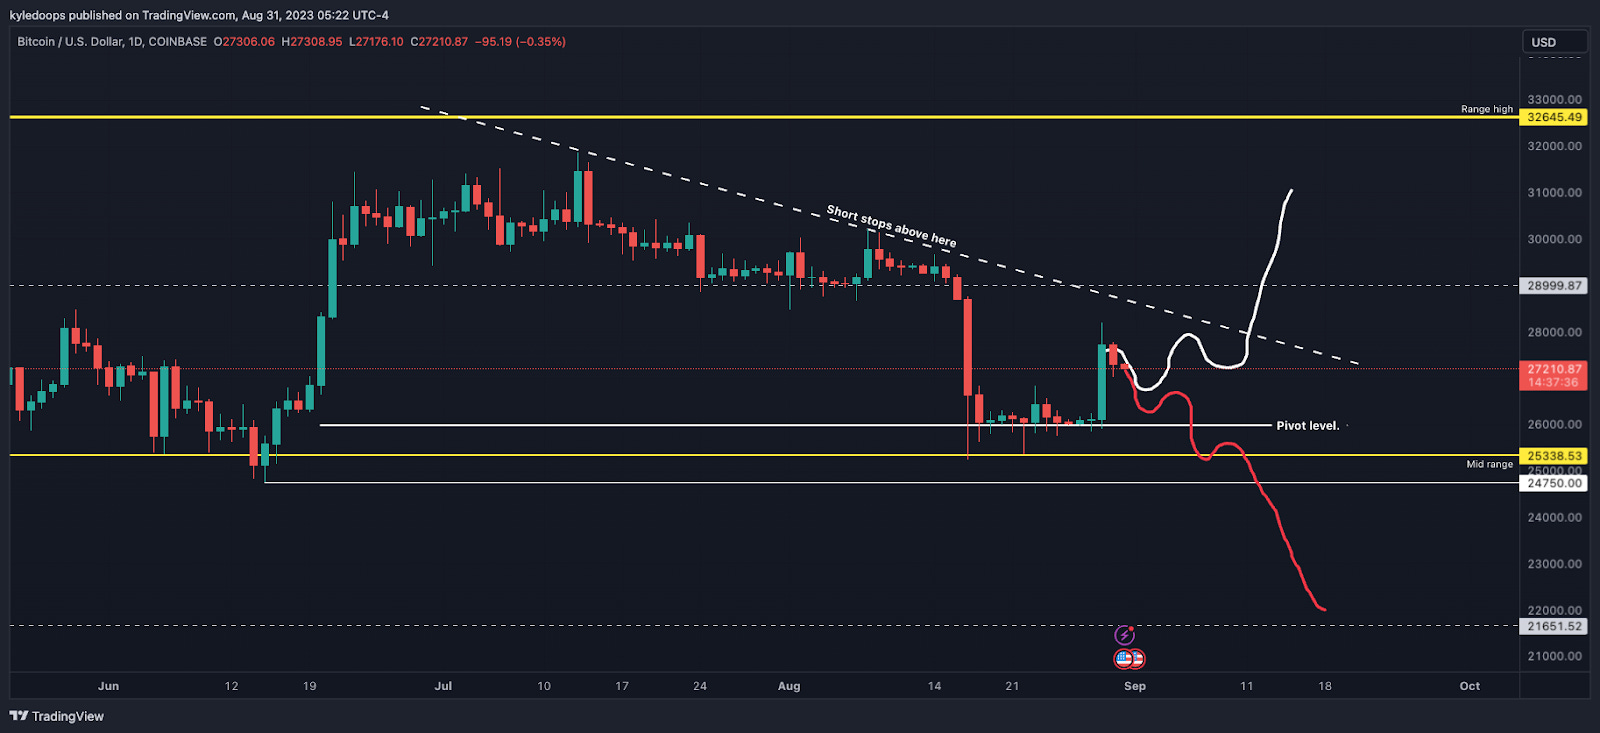
Bitcoin is retracing some of the impulsive move to the upside. This can be expected in light of the imbalance left behind.
It's important for bulls to hold $26,800 today and then to close the weekly above $27,700. If they can do this, it's on, and the white trajectory outlined may be next, which would be a greater short squeeze.
If they do a full retrace, then the momentum from bears will likely be too great to deny, and consequently, $23,500 is next.
𝗣𝗿𝗶𝗺𝗲 𝗫𝗕𝗧
Sign up for a new Trading Account on Prime XBT!
Receive a deposit bonus of up to $7,000 with promo code: KyleDoops
Chart #3 - Gold (XAUUSD) Hourly Chart
Chartist: Kyle

(For the chart screenshot, click here.)
Gold could be positioned for a short trade. It's not yet active though; I’ll wait for it to take out the prior higher low, thus making a new lower low, then short into the next lower high.
The basis of this trade is rejection from the down-sloping parallel channel. This would be a momentum swing trade.
I’ll place my stop loss above the recent highs.
Claim your Bitget sign-up bonuses here (details below).
Chart #4 - Polygon (MATICUSDT) Daily Chart
Chartist: Sheldon
(For the chart screenshot, click here.)
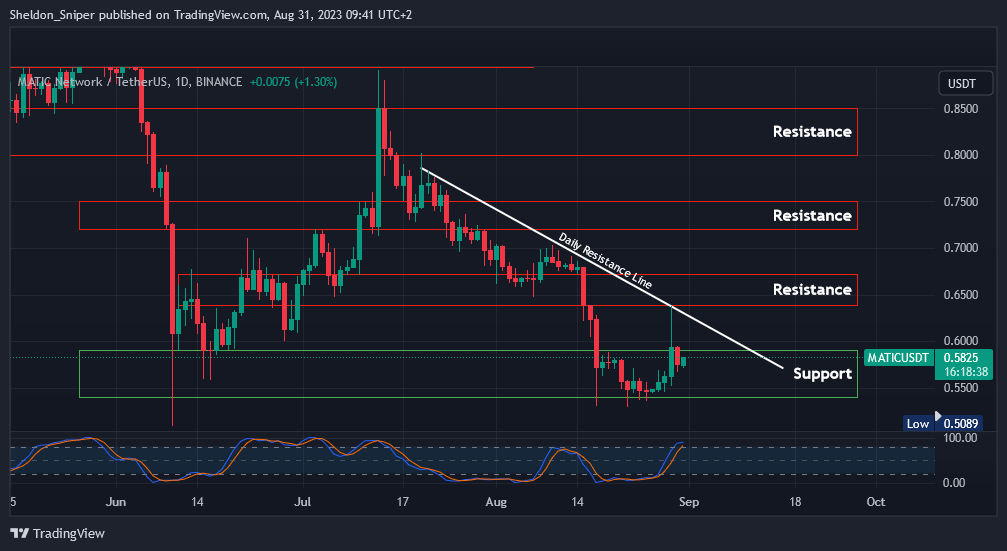
After finding support at $0.54 last week, MATIC has reversed its trend, and this week we saw it spike up to $0.64 before retracing to where it is currently trading at just over $0.58.
If the market can continue its trend to the upside, MATIC could attempt to break through the $0.64 - $0.67 area of resistance and the daily descending resistance line from mid-July.
If the price continues to retrace from here, there could possibly be another test of the $0.54 range low level of support.
Claim your Bitget sign-up bonuses here (details below).
Chart #5 - Fear and Greed Index
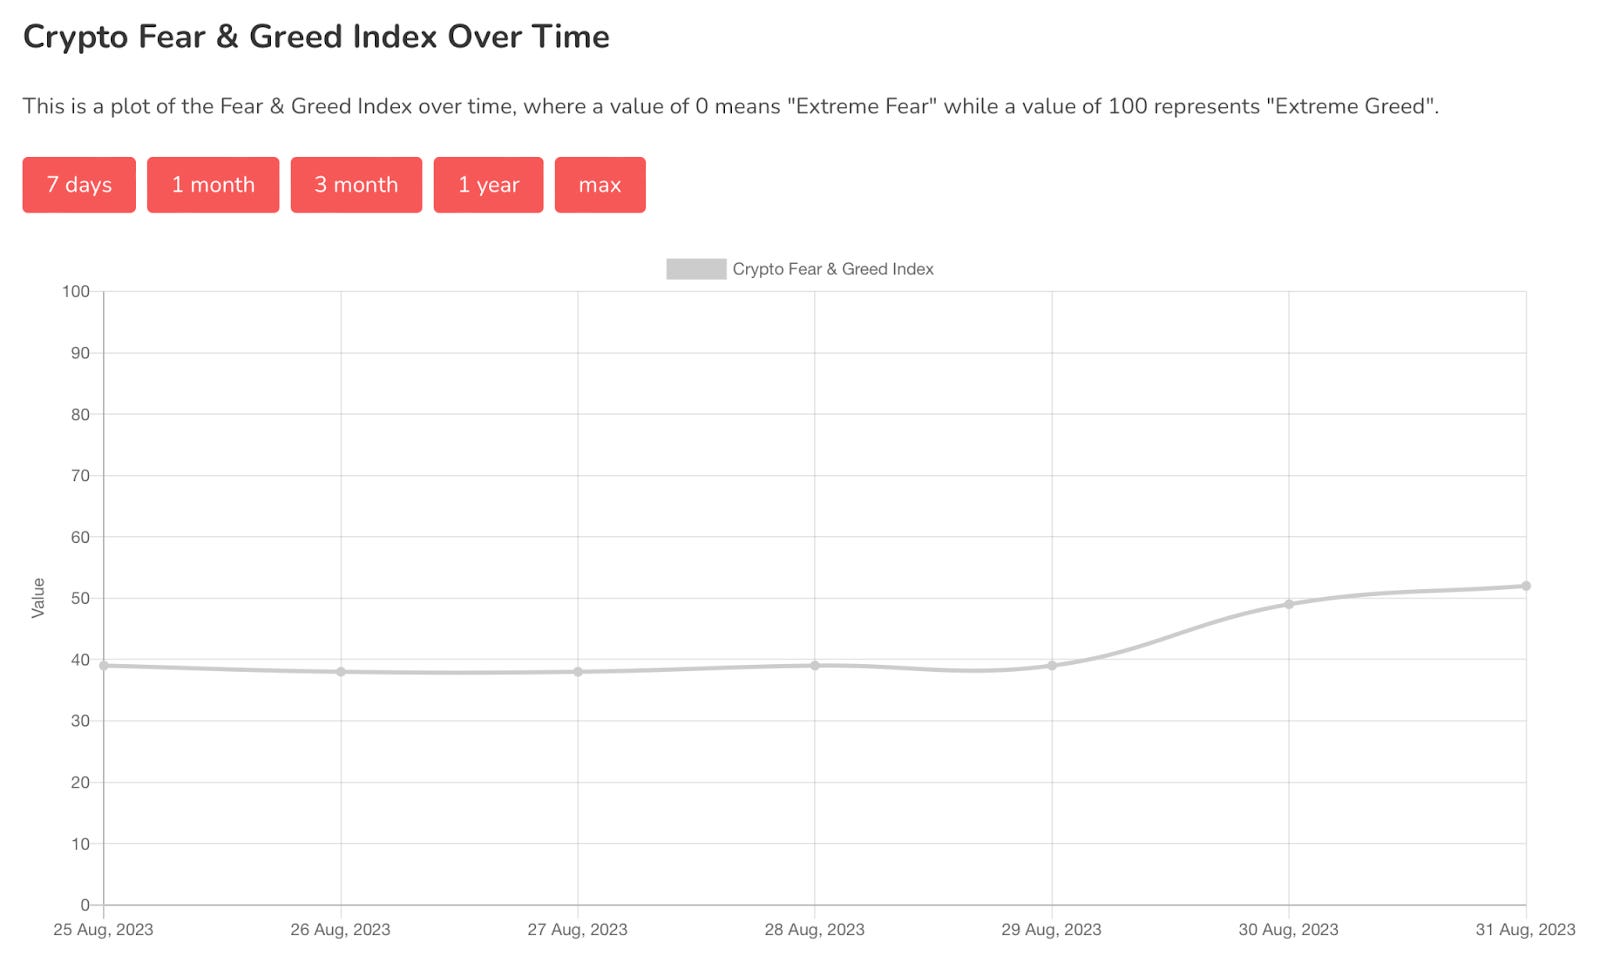
The Fear and Greed Index is sitting at 52 today, Neutral.
The highest the index has been over the past seven days is 52, and the lowest is 38.
Banter’s Take
Most cryptos are in a no-trade zone. Most trades will activate off of the monthly close today and then more so the weekly close on Sunday.
Stay safe my friends!
Go to our Crypto Banter Discord here where Sheldon and Kyle give updates on the charts and trades from The Daily Candle newsletter!