

BTC Holds Bullish + MATIC's Five-Week Downtrend
BTC Holds Bullish + MATIC's Five-Week Downtrend

Overview
Chart #1 - Fantom (FTMUSDT) 12-Hour Chart
Chart #2 - Bitcoin (BTCUSD) Weekly Chart
Chart #3 - Bitcoin Dominance (BTC.D) Weekly Chart
Chart #4 - Polygon (MATICUSDT) 12-Hour Chart
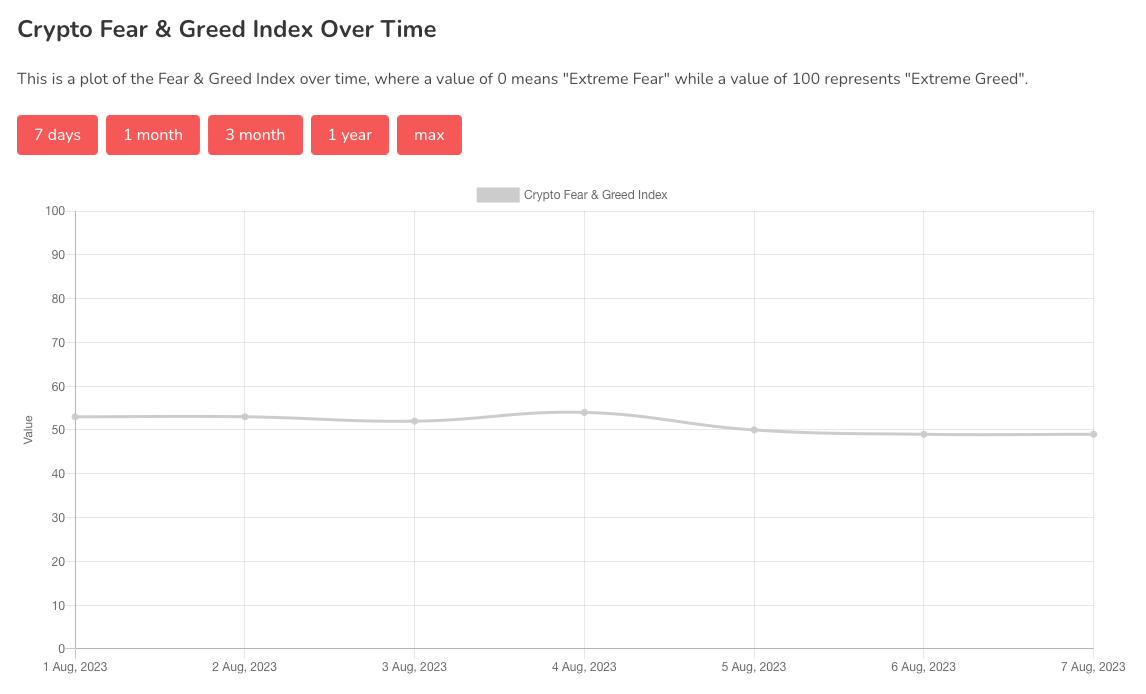
Chart #5 - Fear and Greed Index

Chart #1 - Fantom (FTMUSDT) 12-Hour Chart
Chartist: Sheldon
(For the chart screenshot, click here.)
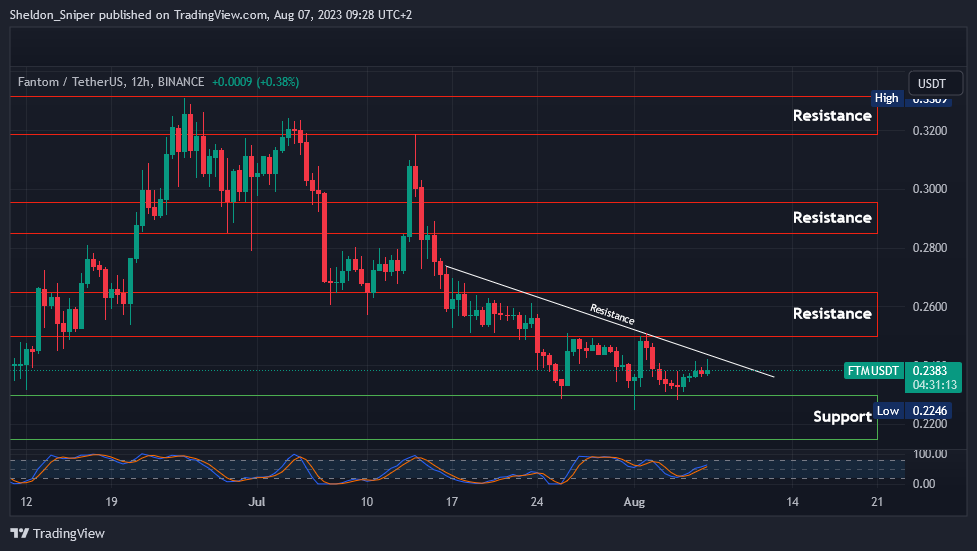
FANTOM has retraced by almost 50% over the last six weeks and is currently very oversold on higher time frames.
This past week, FANTOM has retested the $0.23 area of support where price moved off that support and is currently testing both the $0.24 level and the descending resistance line from mid-July, which are acting as resistance.
If the price can break $0.24, then it may test $0.25 - $0.265. On the downside, if price retraces from here and breaks the $0.23 support, then the next support is at the bottom of the range at $0.21.
Sign-up and trade on Bybit today.
Exclusive $30,000 deposit rewards and bonuses up for grabs!
Chart #2 - Bitcoin (BTCUSD) Weekly Chart
Chartist: Kyle
(For the chart screenshot, click here.)
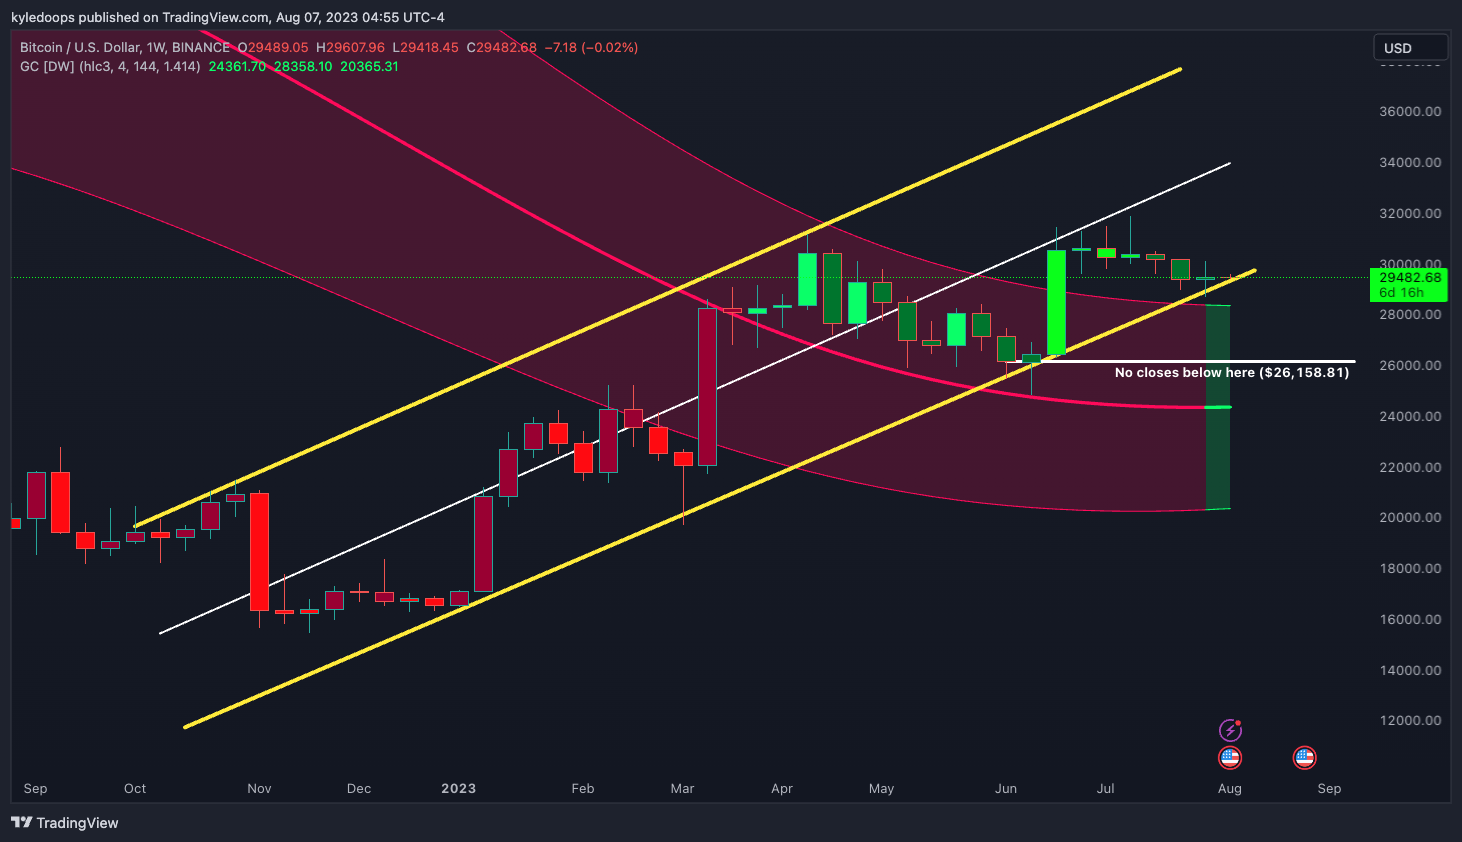
The price is still constrained within the parallel channels and is at a critical support level.
The Gaussian channel has officially flipped to bullish.
As a trend trader, it's reasonable to expect that these levels will hold and lead to a continuation higher. This implies that we should interpret this as the next higher low.
𝗣𝗿𝗶𝗺𝗲 𝗫𝗕𝗧
Sign up for a new Trading Account on Prime XBT!
Receive a deposit bonus of up to $7,000 with promo code: KyleDoops

Sign up for a new Trading Account on Prime XBT!
Receive a deposit bonus of up to $7,000 with promo code: SheldonSniper
Chart #3 - Bitcoin Dominance (BTC.D) Weekly Chart
Chartist: Kyle
(For the chart screenshot, click here.)
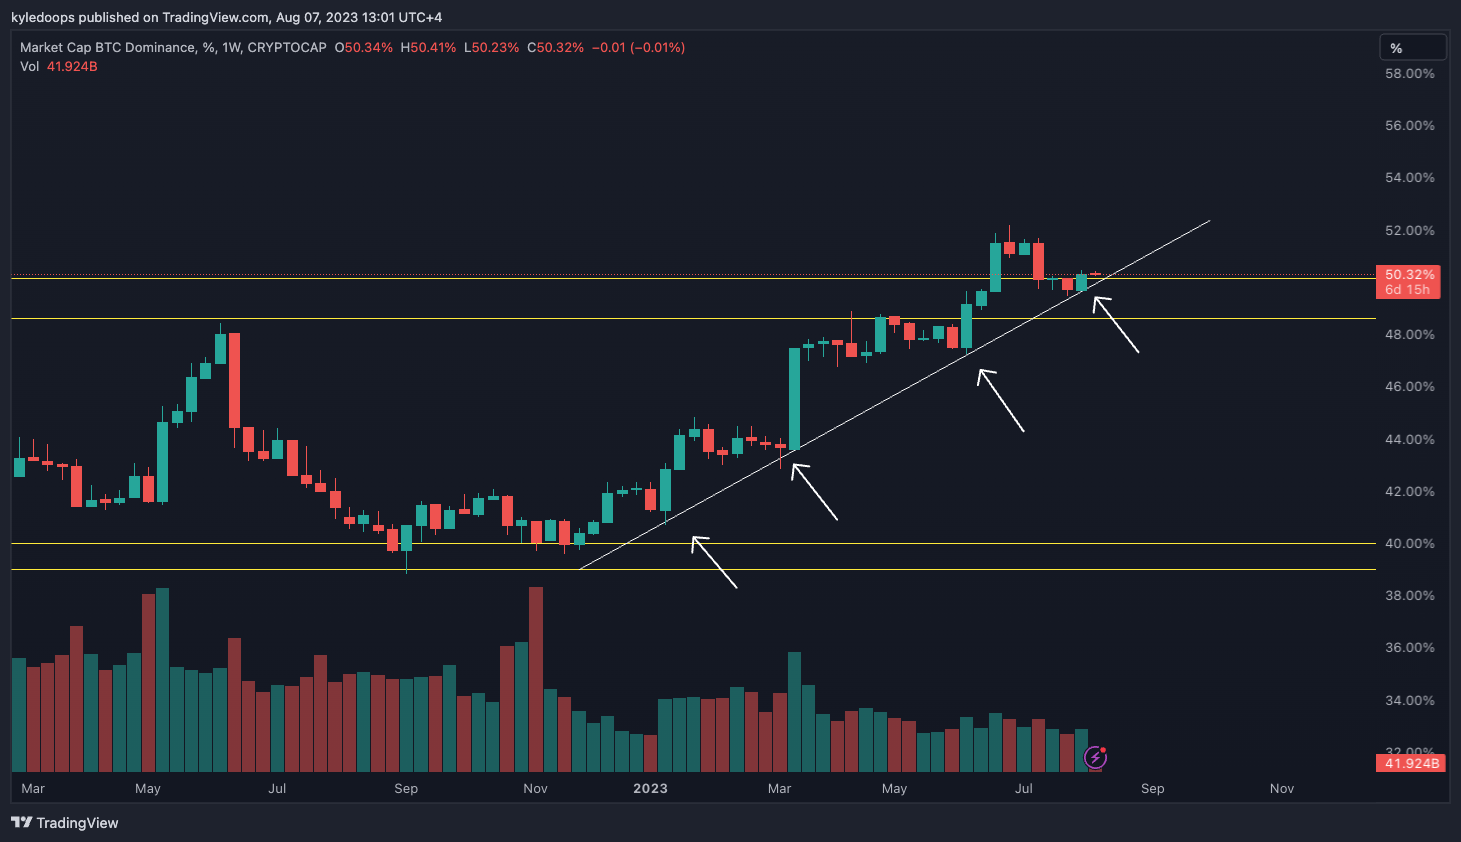
BTC Dominance may also be in the process of trending higher.
It's currently attempting to form a higher low on the weekly chart, following a backtest into the range high support.
As long as this range high at the 48 - 50% level holds, and the price does not break down the diagonal trend line, then one would expect a continuation higher.
Claim your Bitget sign-up bonuses here (details below).
Chart #4 - Polygon (MATICUSDT) 12-Hour Chart
Chartist: Sheldon
(For the chart screenshot, click here.)
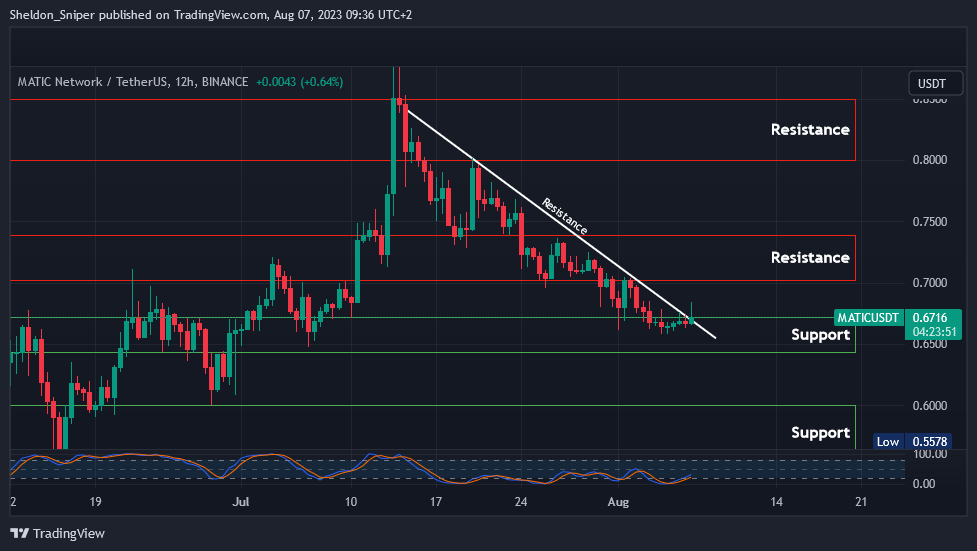
MATIC has been in a downtrend over the past five weeks and is currently oversold on higher time frames.
Over the last week, the price has managed to stabilize around the $0.67 level of support, and it appears to be preparing to ascend, potentially to test the next area of resistance at $0.70 - $0.74.
However, if the market retraces from here and MATIC loses the $0.65 - $0.67 area, then the next level of support lies at $0.56 - $0.60.
Claim your Bitget sign-up bonuses here (details below).
Chart #5 - Fear and Greed Index
The Fear and Greed Index is sitting at 49 today, Neutral.
The highest the index has been over the past seven days is 54, and the lowest is 49.
Banter’s Take
The market has been contracting for an extended period now, and market participants are eagerly awaiting the next major move. With Bitcoin price still maintaining the trend with higher highs and higher lows, the odds still lean in favor of the bulls.
Stay safe my friends!
Go to our Crypto Banter Discord here where Sheldon and Kyle give updates on the charts and trades from The Daily Candle newsletter!