

📈📉 BTC MUST Hold THIS Level or $32k Is NEXT!
📈📉 BTC MUST Hold THIS Level or $32k Is NEXT!
PLUS: CRUCIAL SOL Levels to Watch!
Overview
Chart #1 - Ethereum (ETHUSDT) Daily
Chart #2 - Bitcoin (BTCUSD) Daily
Chart #3 - Bitcoin Dominance (BTC.D) Weekly
Chart #4 - Solana (SOLUSDT) 8-Hour
Chart #5 - Fear and Greed Index
Chart #1 - Ethereum (ETHUSDT) Daily
Chartist: Sheldon
(For the chart screenshot, click here.)
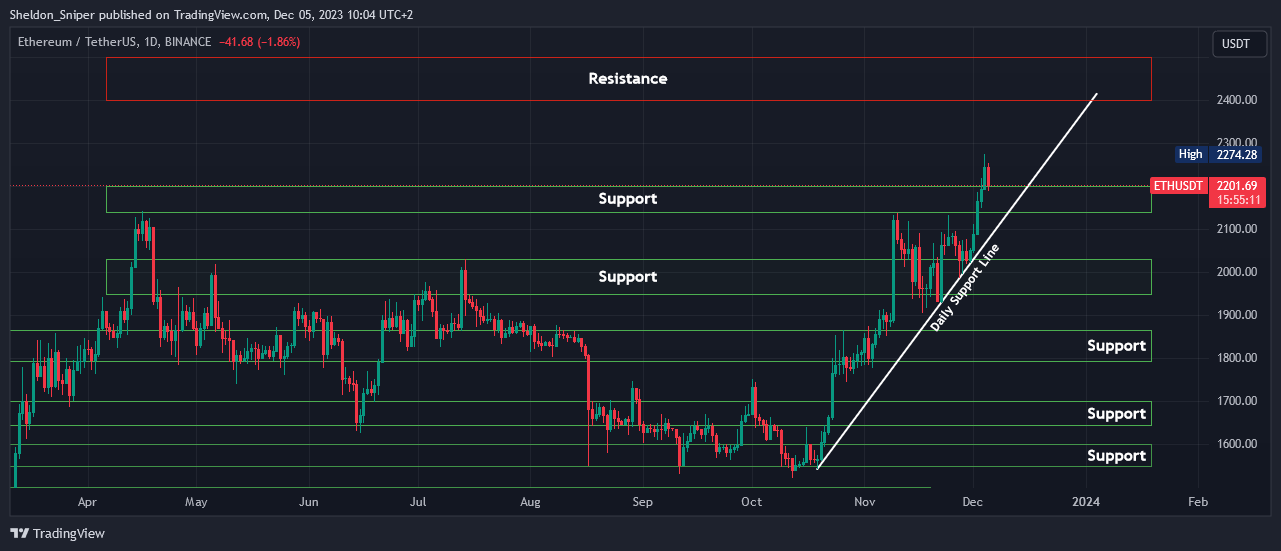
BTC Dominance chart is hitting at a pullback, which could give some relief to the alts - like ETH.
ETH is trading at the $2,200 level of support, and will likely range between $2,140 - $2,200 before going up to test the next area of resistance at $2,400 - $2,500.
The ascending trend line from mid-October intersects in the $2,100 - $2,200 area and will be acting as additional support.
Sign-up and trade on Bybit today.
Exclusive $30,000 deposit rewards and bonuses up for grabs!
Chart #2 - Bitcoin (BTCUSD) Daily
Chartist: Kyle
(For the chart screenshot, click here.)
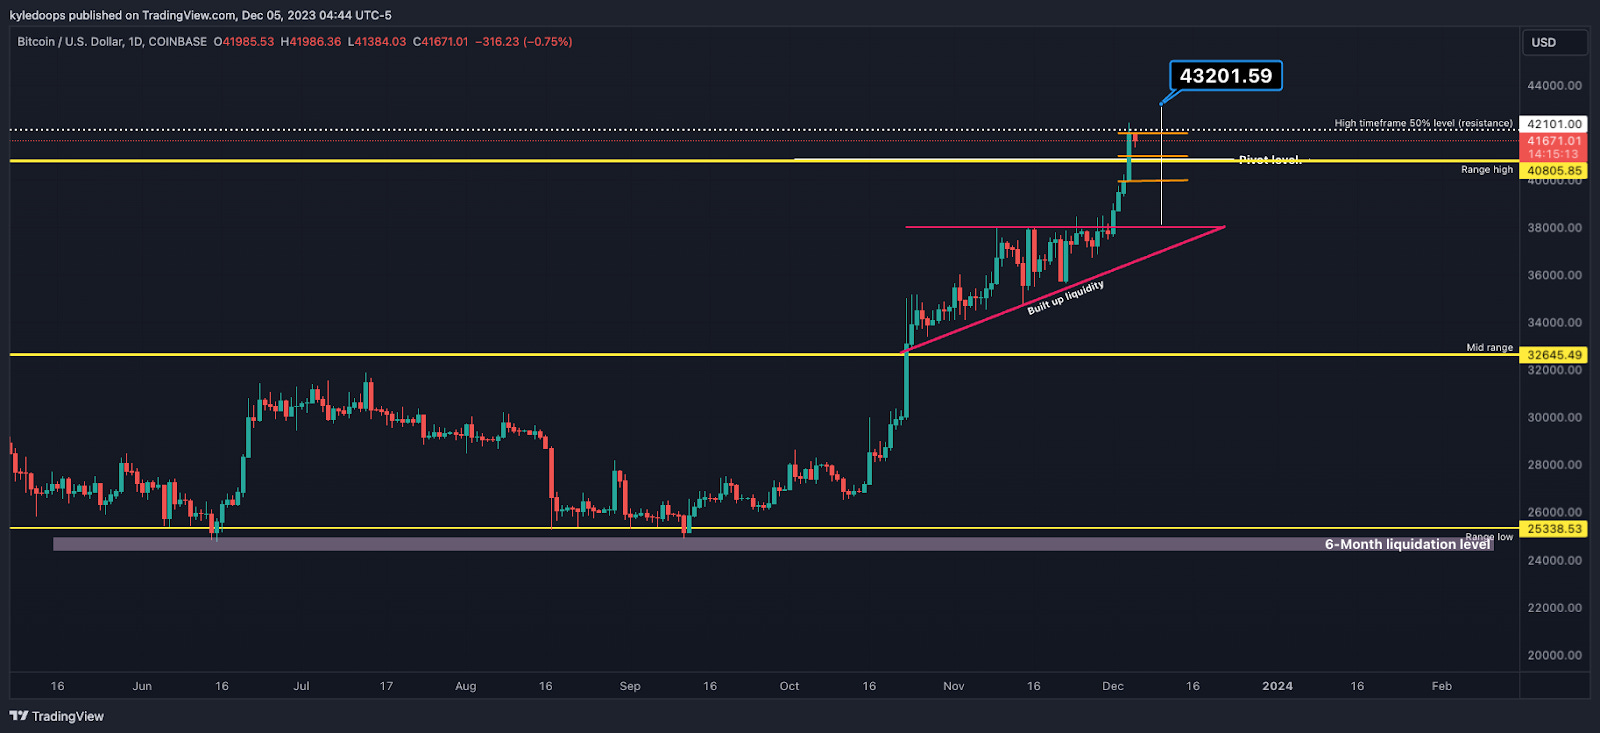
Bitcoin had a very strong close yesterday but still closed below the 50% Fibonacci retracement level at $42,101.
The measured move for the ascending triangle technical breakout is up to $43,201.
The yellow lines represent the current range high, mid-range, and range low.
If Bitcoin breaks back below the range high, then a deeper pullback could be in play, which might send the price down to $32,645.
That pivot level at $40,805 is an important one to keep an eye on.
Claim your Bitget sign-up bonuses here (details below).

Outsmart 99% Of The Market!
Get full access into our Discord And Telegram group, where you'll find all of our premium content!
👉 Trade Signals!
👉 Trade Set-Ups!
👉 Trading Challenges!
👉 Education!
👉 SO MUCH MORE!
Chart #3 - Bitcoin Dominance (BTC.D) Weekly
Chartist: Kyle
(For the chart screenshot, click here.)
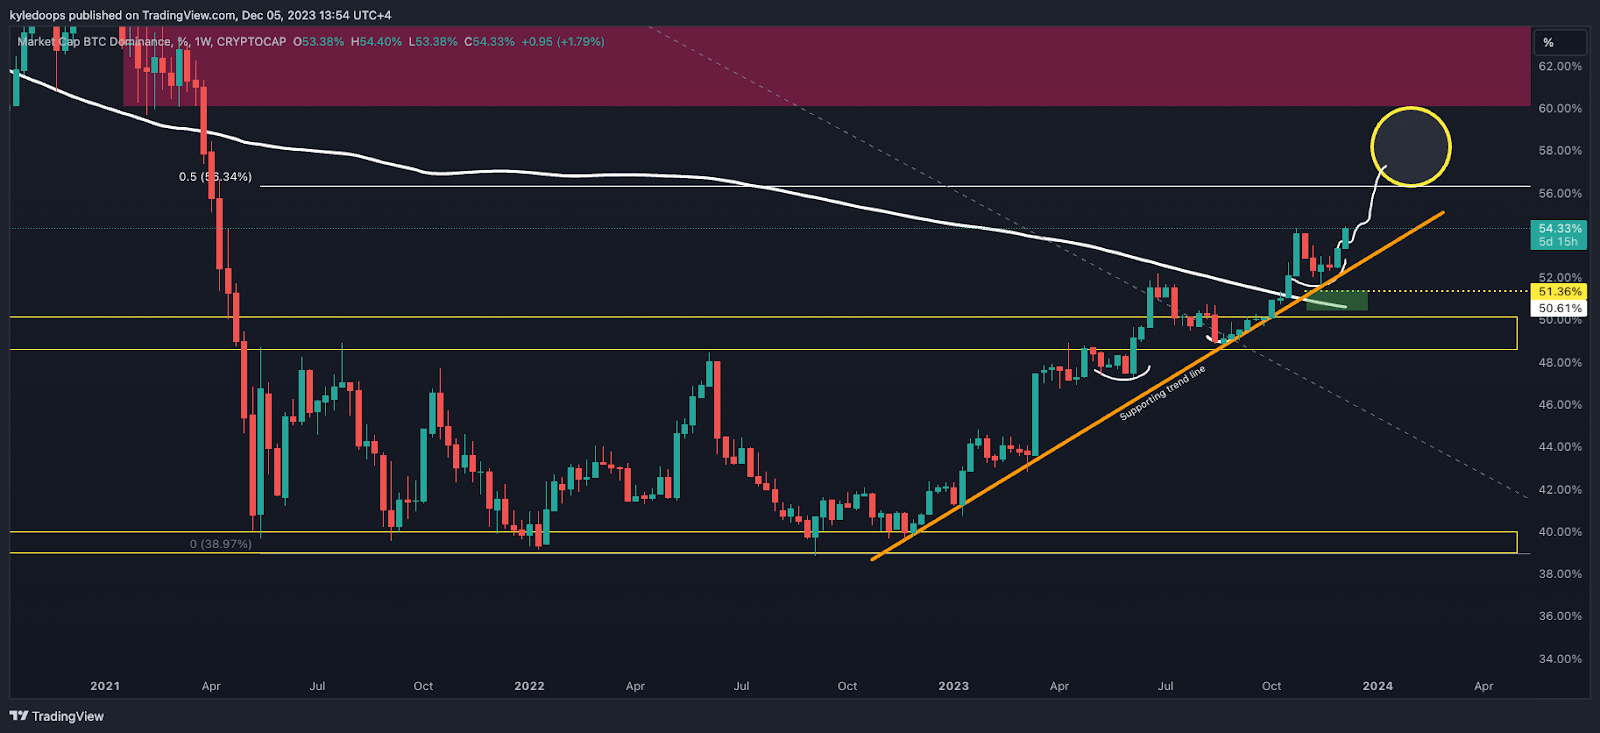
Bitcoin dominance is pushing hard towards the upside but will likely meet resistance at 55-60%.
This follows a breakout from a 2-year consolidation and a reclaim of the 200-week moving average.
However, I think there is a strong likelihood of Bitcoin dominance pulling back more aggressively from that 55-60% area. The supporting trend line is clear; if lost, then look for support at the range high.
Claim your Bitget sign-up bonuses here (details below).
Chart #4 - Solana (SOLUSDT) 8-Hour
Chartist: Sheldon
(For the chart screenshot, click here.)
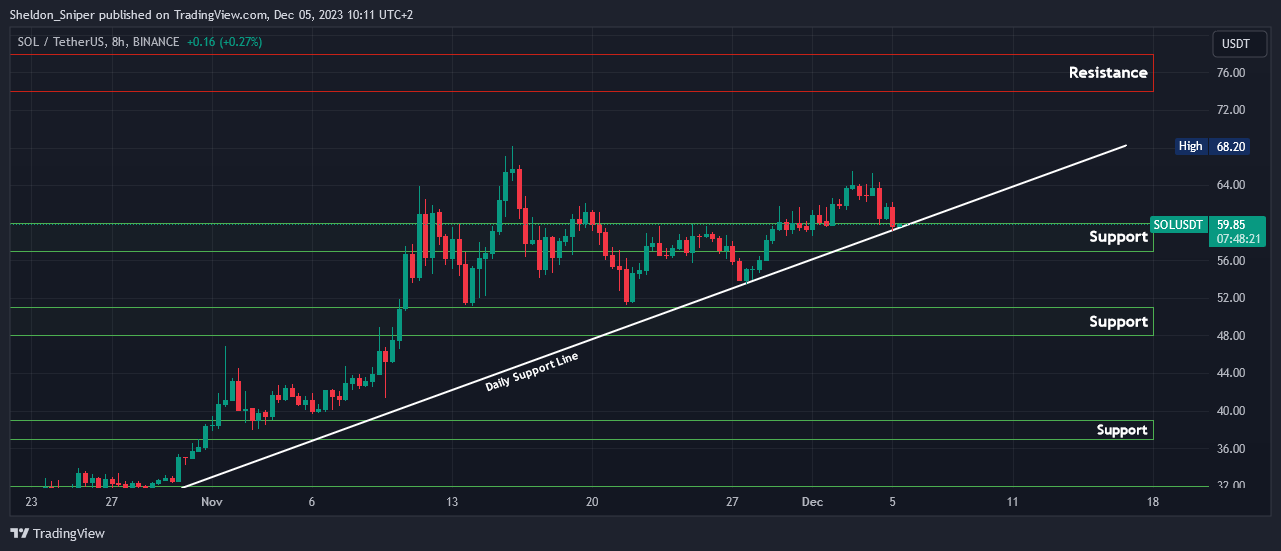
SOL has come down to the top of the range support of $60 and the ascending support line.
If it can hold here, it should test $74 - $78 next.
But, if the daily support line is broken, we’re looking at $56.50.
Lose that, and we are heading to $48 - $51.50!
Claim your Bitget sign-up bonuses here (details below).
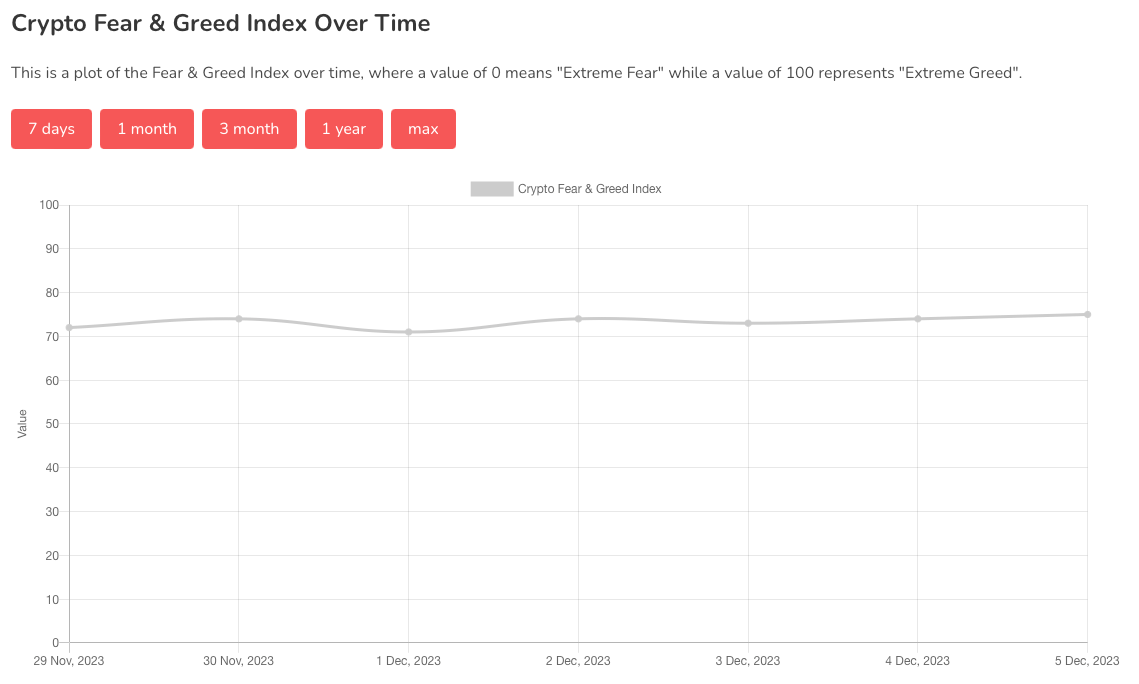
Chart #5 - Fear and Greed Index
The Fear and Greed Index is sitting at 75 today, indicating Greed.
The highest the index has been over the past seven days is 75, and the lowest is 71.
Banter’s Take
Bitcoin is currently leading the market, with altcoins lagging. However, in the next few weeks, this dynamic could shift, potentially leading to altcoins gaining momentum.
Stay safe my friends!
Go to our Crypto Banter Discord here where Sheldon and Kyle give updates on the charts and trades from The Daily Candle newsletter!