

📈📉BTC Must Hold THIS Level to Remain BULLISH!
📈📉BTC Must Hold THIS Level to Remain BULLISH!
The market is poised for a significant shift. The major trades to watch include...
Overview
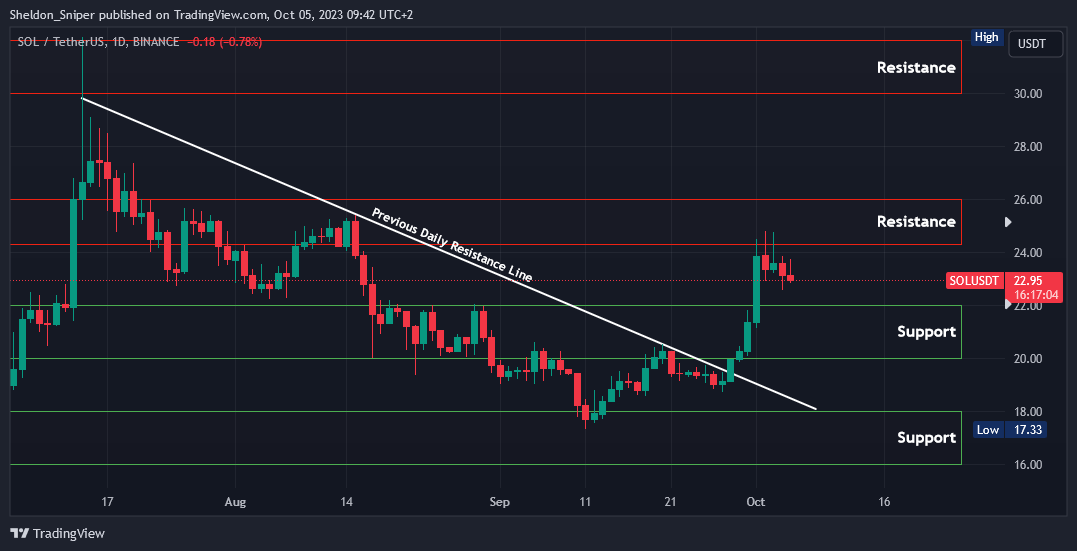
Chart #1 - Solana (SOLUSDT) Daily
Chart #2 - Bitcoin (BTCUSD) Hourly
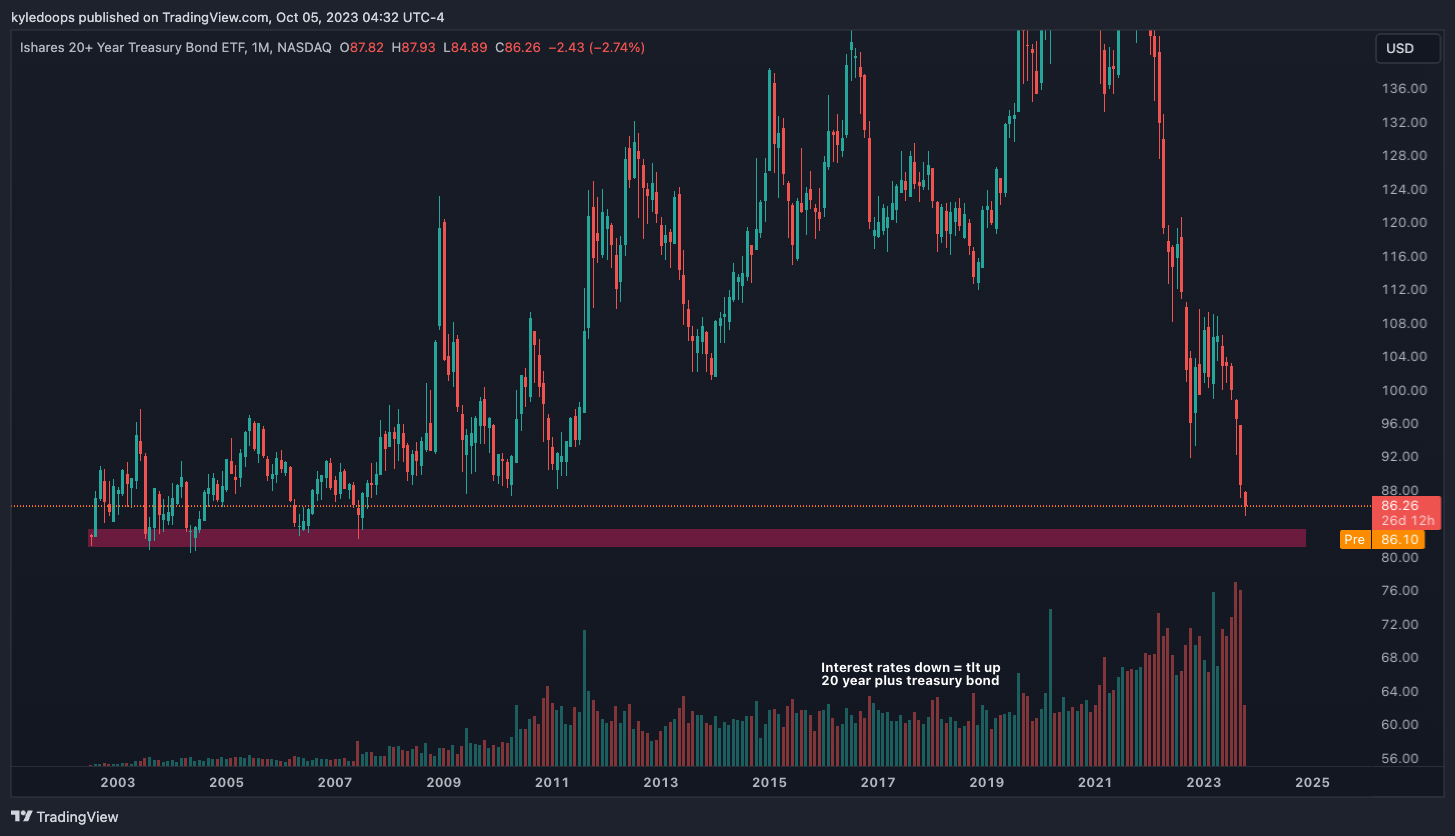
Chart #3 - 20+ Year Treasury Bond ETF (TLT) Monthly
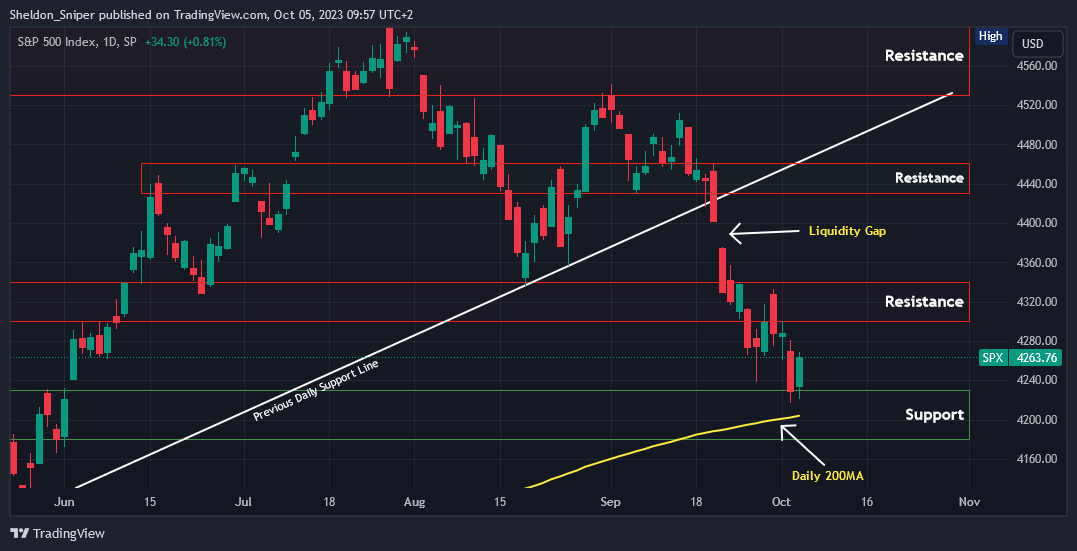
Chart #4 - S&P 500 (SPX) Daily
Chart #5 - Fear and Greed Index

Chart #1 - Solana (SOLUSDT) Daily
Chartist: Sheldon
(For the chart screenshot, click here.)
After hitting a current high of $24.80 earlier in the week, the price of SOL has been correcting to test the next major area of support, which starts at around $22.00.
If that area of support holds, it should provide a long trade entry for SOL to go and test the $24 - $26 area once again, or even higher up at the $28 level of resistance.
The price action of SOL has been very bullish since the middle of September, and I feel that, on a higher time frame, it will remain that way over the next couple of weeks.
Sign-up and trade on Bybit today.
Exclusive $30,000 deposit rewards and bonuses up for grabs!
Chart #2 - Bitcoin (BTCUSD) Hourly
Chartist: Kyle

(For the chart screenshot, click here.)
Bitcoin is reverting back into its range.
I have drawn a tight trend line; I expect that to break. At that point, the price is likely to bounce off the 50 EMA on the 4-hour chart and then the 200 EMA.
Our next task will be to evaluate if the bounce results in a lower high. If so, expect a continuation down to $26,400. If it holds the 200 EMA at $26,800, then a trend continuation is possible.
Claim your Bitget sign-up bonuses here (details below).
Chart #3 - 20+ Year Treasury Bond ETF (TLT) Monthly
Chartist: Kyle
(For the chart screenshot, click here.)
TLT represents the 20-year plus treasury bond. People purchase this if they believe interest rates are going to decrease.
If this chart is trending downward, it's because interest rates are rising.As soon as the FED pivots, this will surge significantly.
The horizontal support at 80 could be our first indication that a strong bounce is imminent, suggesting that interest rates might be cut since something is likely to give.
Claim your Bitget sign-up bonuses here (details below).
Chart #4 - S&P 500 (SPX) Daily
Chartist: Sheldon
(For the chart screenshot, click here.)
Yesterday, the SPX found support near the daily 200 Moving Average at approximately 4,215 and closed positively at 4,263.
It is currently oversold, suggesting potential upside in the coming weeks. However, it might take some time to reach the higher, targeted resistance areas. My target for the SPX is to close the liquidity gap from 20 – 21 September at 4,400.
As mentioned, it could take a week or two to reach this targeted level, with the 4,300 – 4,340 resistance area needing to be broken first.
Claim your Bitget sign-up bonuses here (details below).
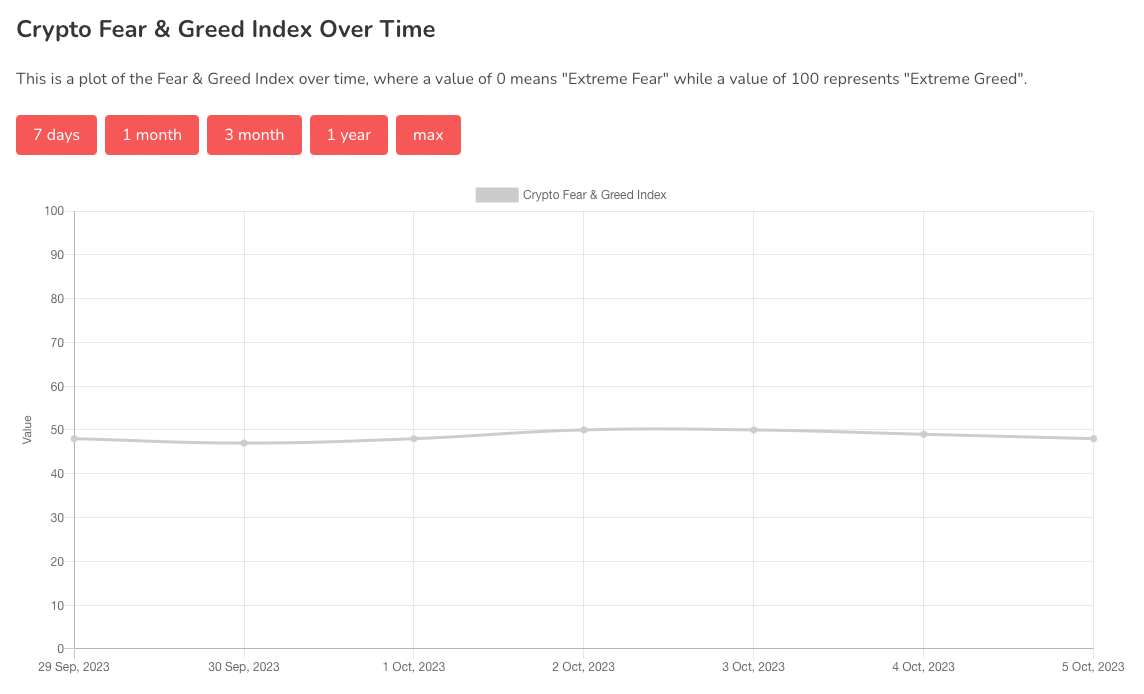
Chart #5 - Fear and Greed Index
The Fear and Greed Index is sitting at 48 today, Neutral.
The highest the index has been over the past seven days is 50, and the lowest is 47.
Banter’s Take
The market is poised for a significant shift. The major trades to watch include the DXY approaching a significant peak, 10-year yields nearing a top, a potential bottom for TLT, an anticipated bounce zone for the S&P 500, and BTC maintaining its support.
Stay safe my friends!
Go to our Crypto Banter Discord here where Sheldon and Kyle give updates on the charts and trades from The Daily Candle newsletter!