

📈📉 BTC Must Hold THIS Level! + UNIBOT’s New Range!
📈📉 BTC Must Hold THIS Level! + UNIBOT’s New Range!

Overview
Chart #1 - S&P 500 (SPX) Daily
Chart #2 - Unibot (UNIBOTUSD) Daily
Chart #3 - Bitcoin (BTCUSD) Daily
Chart #4 - Crypto Total Market Cap (TOTAL) Daily
Chart #5 - Fear and Greed Index

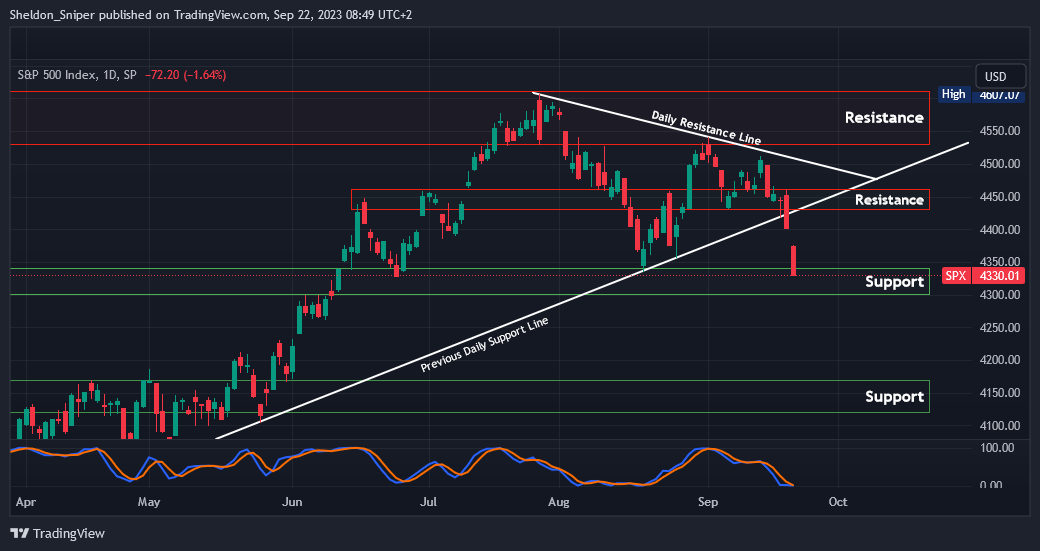
Chart #1 - S&P 500 (SPX) Daily Chart
Chartist: Sheldon
(For the chart screenshot, click here.)
Over the past two trading sessions, the SPX has dropped by almost 3%.
More importantly, it has lost the 4,450 level of support and has also broken the ascending support line that originated at the end of May. It has reached the next area of support, spanning from 4,300 to 4,340, an area that has consistently held as support over the past three months. I expect this support to hold for now and anticipate the SPX to subsequently rise and retest both the break of the ascending Support line and the previous 4,450 support, which will now act as resistance.
If the current 4,300 - 4,340 support zone fails to hold, the next support lies much lower, between 4,120 and 4,170.
Sign-up and trade on Bybit today.
Exclusive $30,000 deposit rewards and bonuses up for grabs!
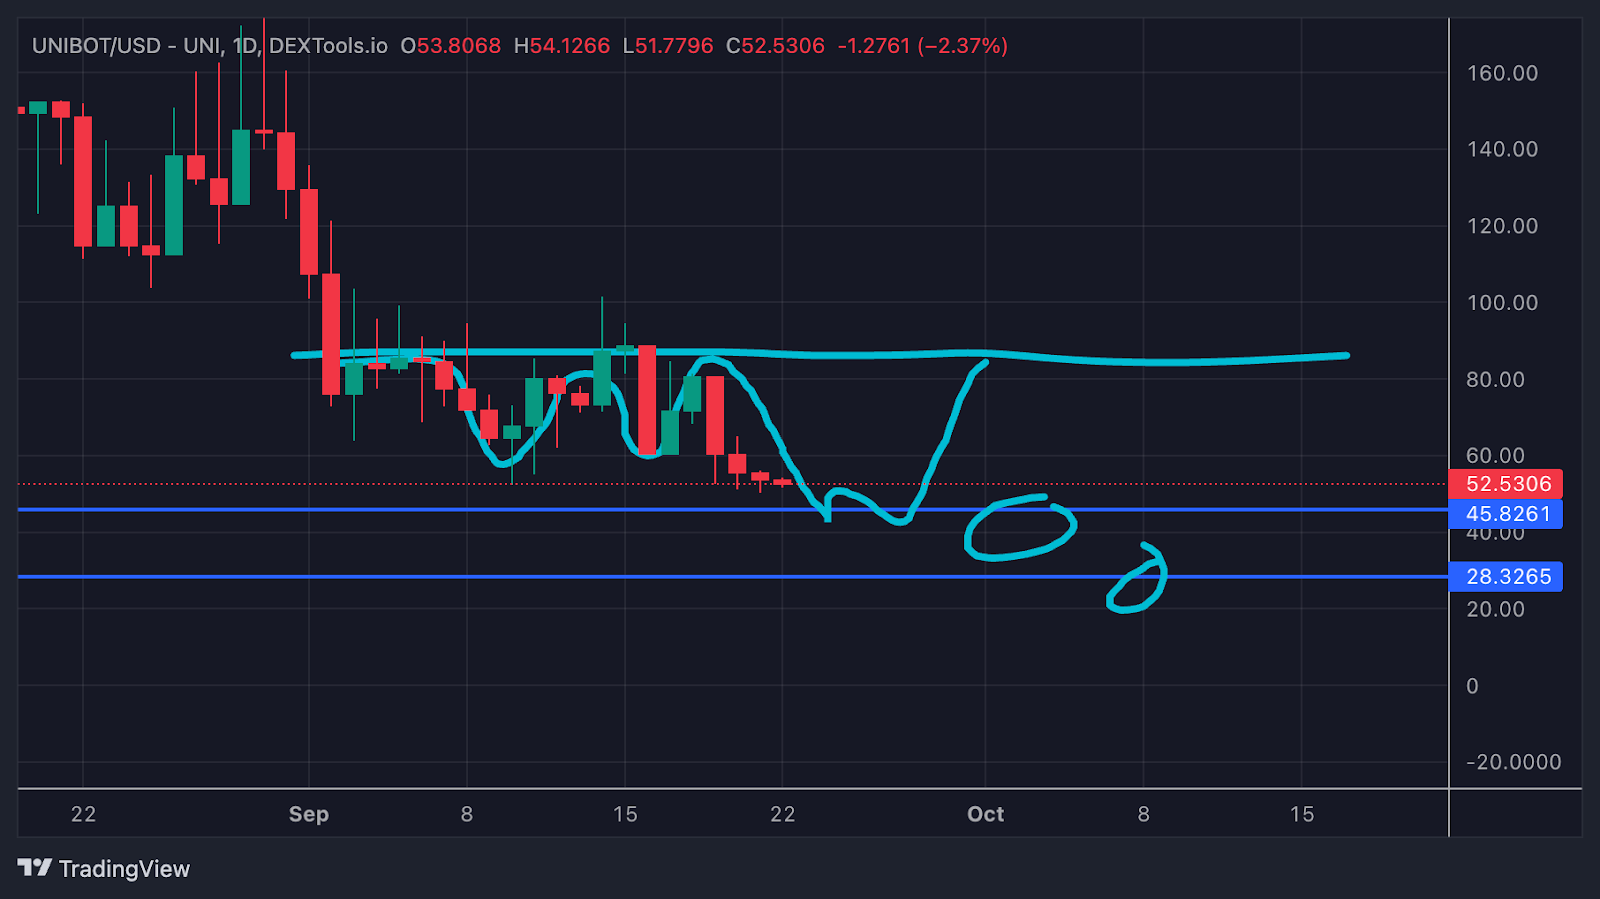
Chart #2 - Unibot (UNIBOTUSD) Daily Chart
Chartist: Kyle
(For the chart screenshot, click here.)
One of the coins we're eyeing for purchase in anticipation of the next bull run is Unibot.
Currently, UNIBOT is establishing a new range. The levels we're keenly watching for a bounce and the formation of a range low are $45 and $28.
Claim your Bitget sign-up bonuses here.
Chart #3 - Bitcoin (BTCUSD) Daily Chart
Chartist: Kyle

(For the chart screenshot, click here.)
Bitcoin is maintaining its position in the mid-range.
As long as the $25,000 level is defended, there remains a possibility that the bulls might attempt another upward move, targeting the quarterly range high of $29,000.
Claim your Bitget sign-up bonuses here.
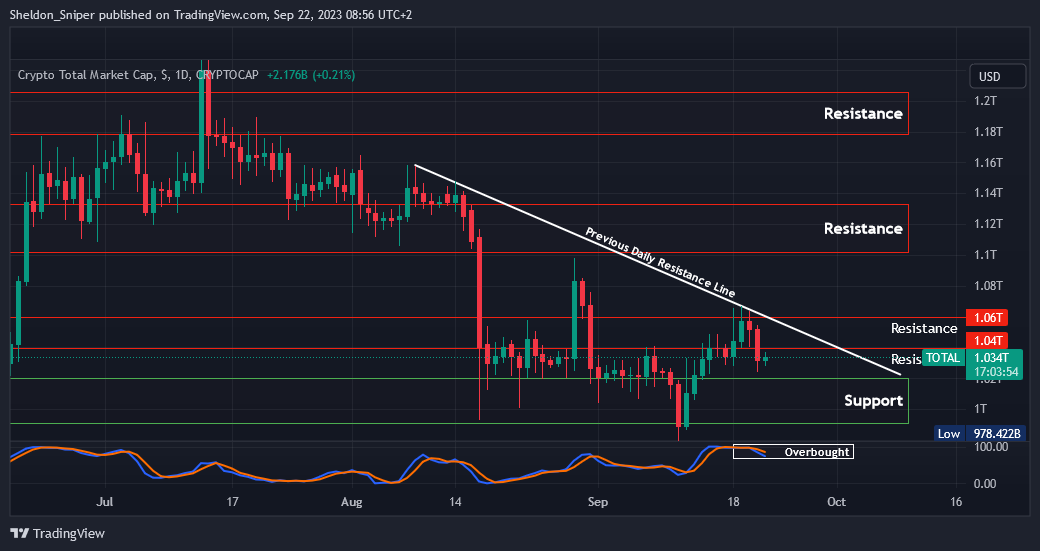
Chart #4 - Crypto Total Market Cap (TOTAL) Daily Chart
Chartist: Sheldon
(For the chart screenshot, click here.)
Yesterday, the TOTAL declined by 3%, moving from $1.055T to $1.025T and, in the process, breached the $1.04T support level.
Currently, it stands at $1.034T and remains significantly overbought on the daily, so the market might oscillate within this range for some time, between the $1.02T support and the now-established $1.04T resistance.
Claim your Bitget sign-up bonuses here.
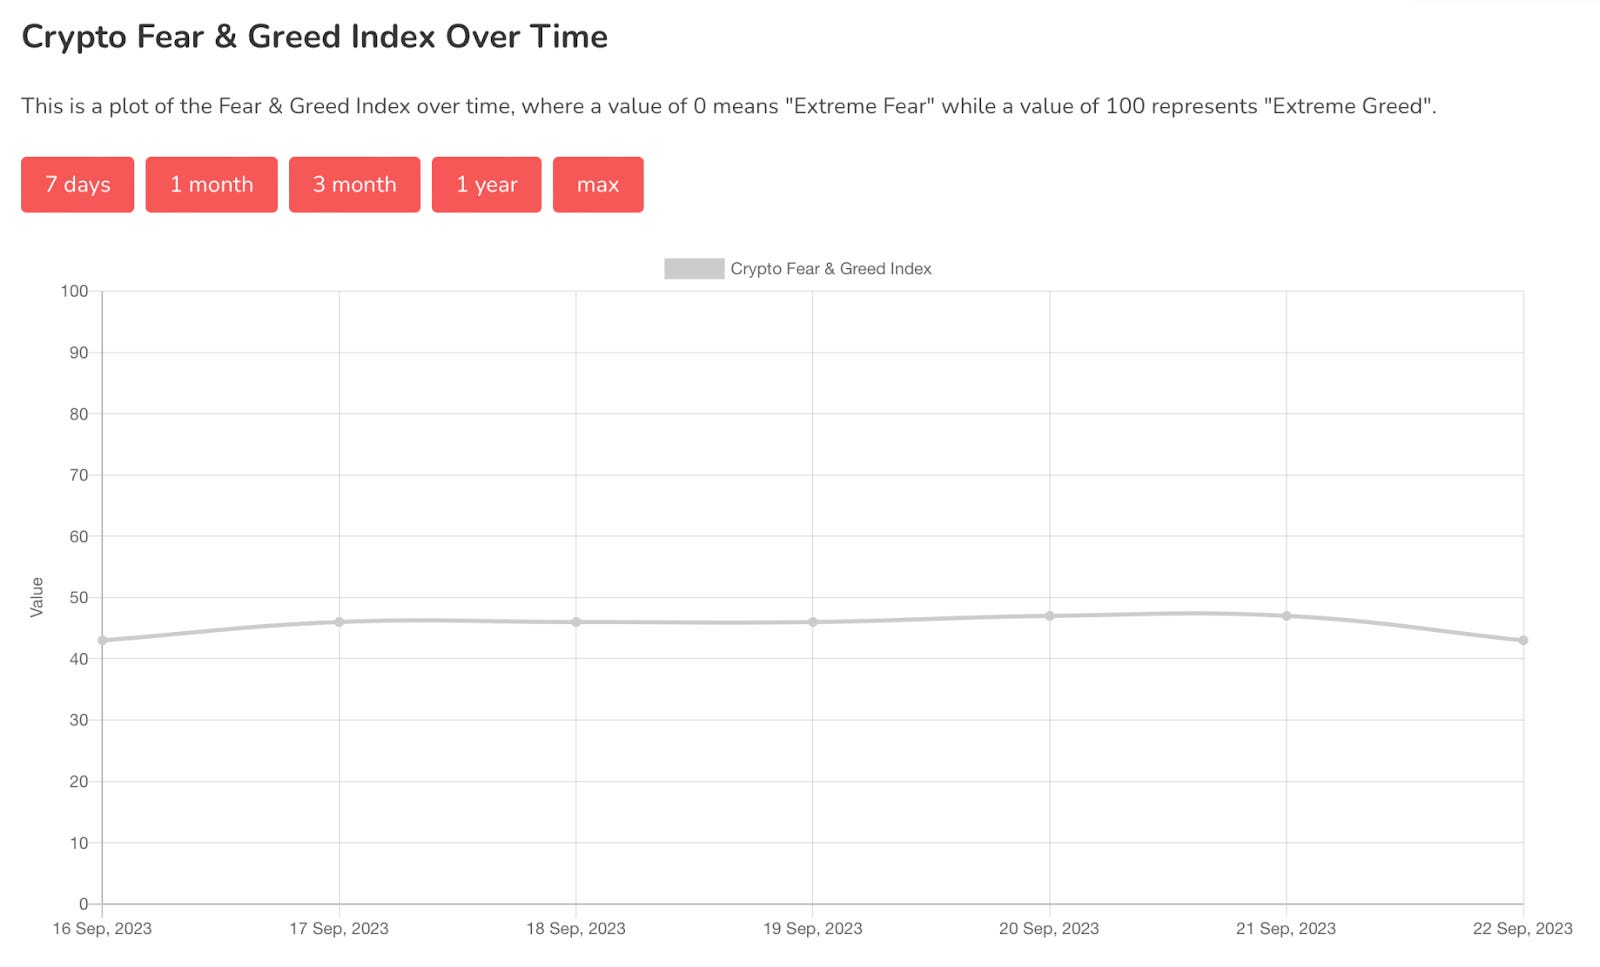
Chart #5 - Fear and Greed Index
The Fear and Greed Index is sitting at 43 today, indicating Fear.
The highest the index has been over the past seven days is 47, and the lowest is 43.
Banter’s Take
Bears have regained some control, but this might just be a reset allowing the bulls to retake the helm.
The stock market is the most significant risk, given that prices need to find support urgently. If it loses its current support levels, it could likely push BTC below the $25,000 support.
Stay safe my friends!
Go to our Crypto Banter Discord here where Sheldon and Kyle give updates on the charts and trades from The Daily Candle newsletter!