

📈📉 BTC Must Reclaim THIS level! Time to LONG Aave?
📈📉 BTC Must Reclaim THIS level! Time to LONG Aave?

Chart #1 - Aave (AAVEUSDT) - Daily
Chart #2 - Bitcoin (BTCUSD) - H1
Chart #3 - U.S. Dollar Index (DXY) - Weekly
Chart #4 - Crypto Total Market Cap (TOTAL) - Daily
Chart #5 - Fear and Greed Index

Real Vision membership packages help you understand the complex world of crypto and macro, with real in-depth analysis!
Get your membership package 👉 here, and benefit from SPECIAL Crypto Banter discounted prices!
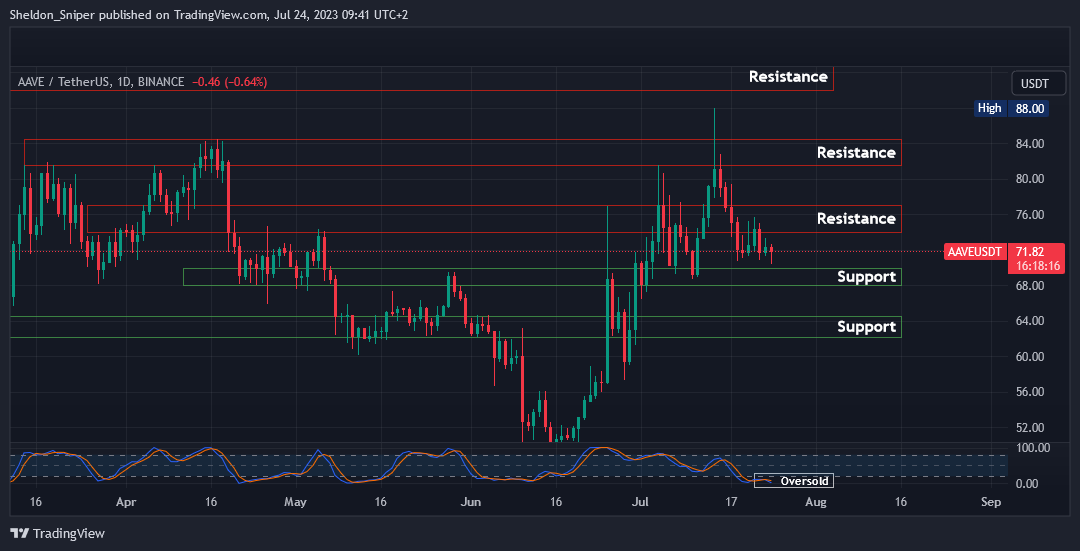
Chart #1 - Aave (AAVEUSDT) - Daily Chart
Chartist: Sheldon
(For the chart screenshot, click here.)
AAVE is trading at $71.80 and is nearing the next major area of support at $68 - $70, where I expect the price to hold.
The Stoch RSI on the daily chart is oversold. If the price stabilizes at this support level, I see an opportunity for a long trade to the next resistance areas, up at $73.50 - $76.50, and thereafter, $82 - $84.
If the $68 - $70 level fails to hold though, price may drop to $62 - $64.
Also, should BTC dominance continue to drop, I anticipate AAVE maintaining its bullish trajectory.
Sign-up and trade on Bybit today.
Exclusive $30,000 deposit rewards and bonuses up for grabs!
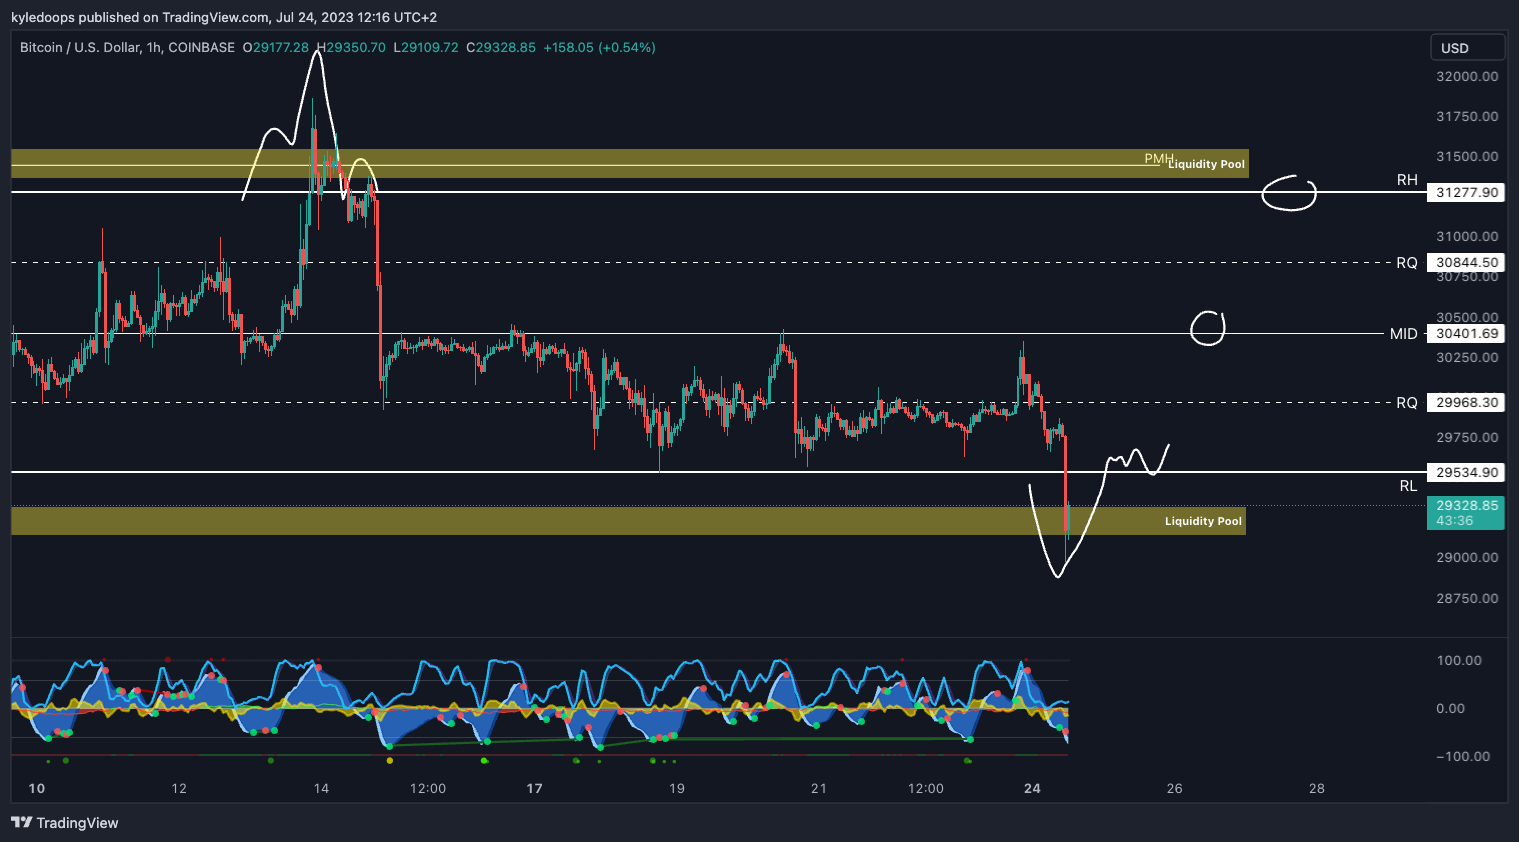
Chart #2 - Bitcoin (BTCUSD) 1-Hour Chart
Chartist: Kyle
(For the chart screenshot, click here.)
Bitcoin has finally swept the liquidity at the lows, which we have been monitoring for quite some time.
Now, we’ll keep an eye out for a reclaim of $29,534, which represents the range lows. Upon such a reclaim, expect the price to continue within its range-bound trading zone.
That suggests a target of $30,401, followed by a subsequent target of $31,278.
𝗣𝗿𝗶𝗺𝗲 𝗫𝗕𝗧
Sign up for a new Trading Account on Prime XBT!
Receive a deposit bonus of up to $7,000 with promo code: KyleDoops

Sign up for a new Trading Account on Prime XBT!
Receive a deposit bonus of up to $7,000 with promo code: SheldonSniper
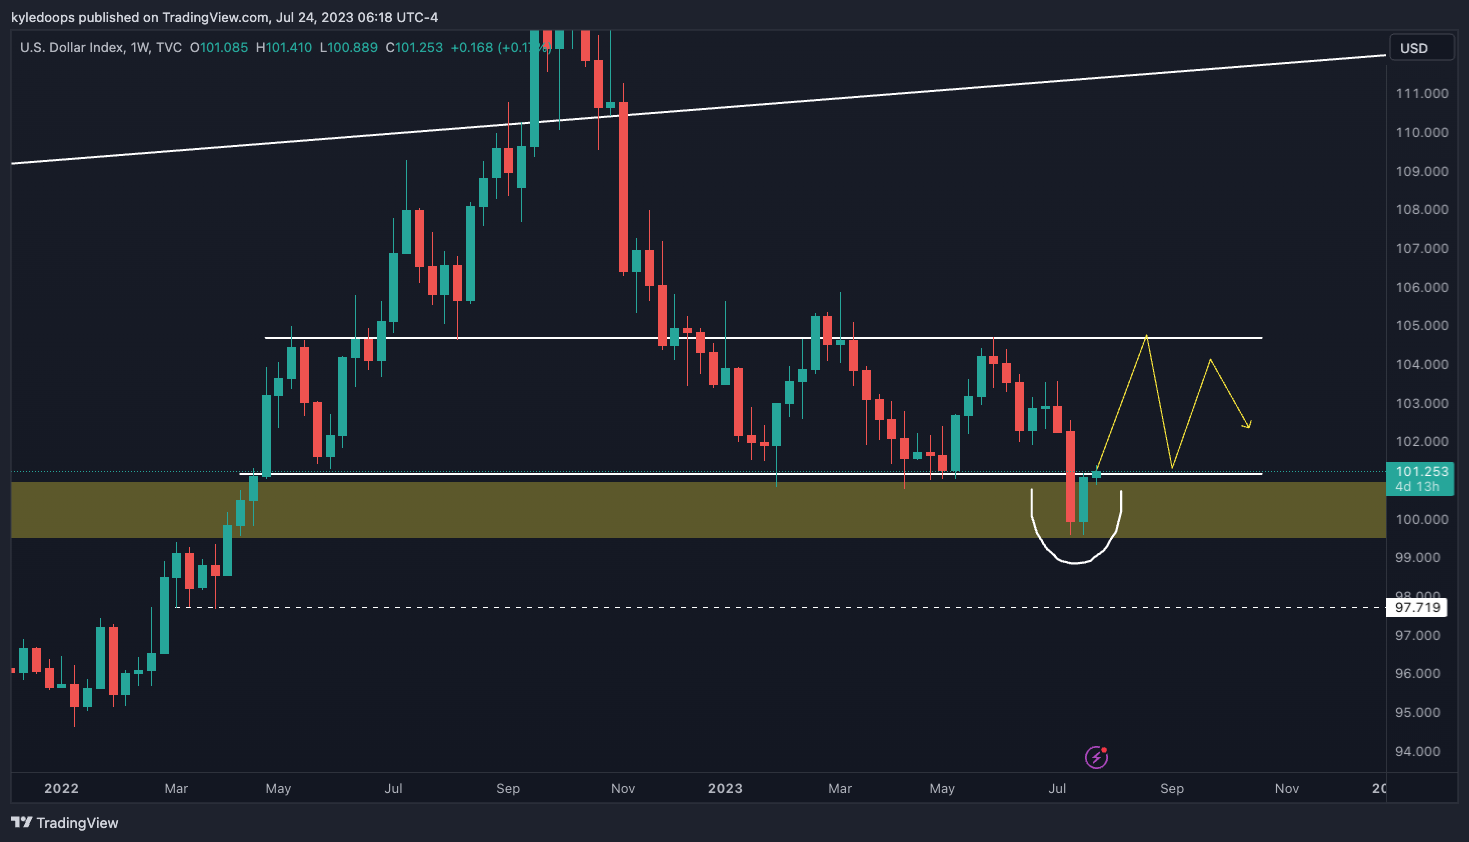
Chart #3 - U.S. Dollar Index (DXY) Weekly Chart
Chartist: Kyle
(For the chart screenshot, click here.)
The DXY might be deviating back into its range; a weekly close above 101.26 should confirm this.
If it reclaims that range, then keep an eye on 104.74 as the next major level.
Claim your Bitget sign-up bonuses here (details below).
Chart #4 - Crypto Total Market cap (TOTAL 1) - Daily Chart
Chartist: Sheldon

(For the chart screenshot, click here.)
The TOTAL has been consolidating in a very tight range, between $1.155T and $1.185T, for over a week now. It is currently at $1.157T.
With the Stoch RSI oversold on the daily, it could now test the $1.18T - $1.2T area. If $1.157T is lost, it will drop to $1.1T - $1.12T - a support area that has been holding since mid-June.
Claim your Bitget sign-up bonuses here (details below).
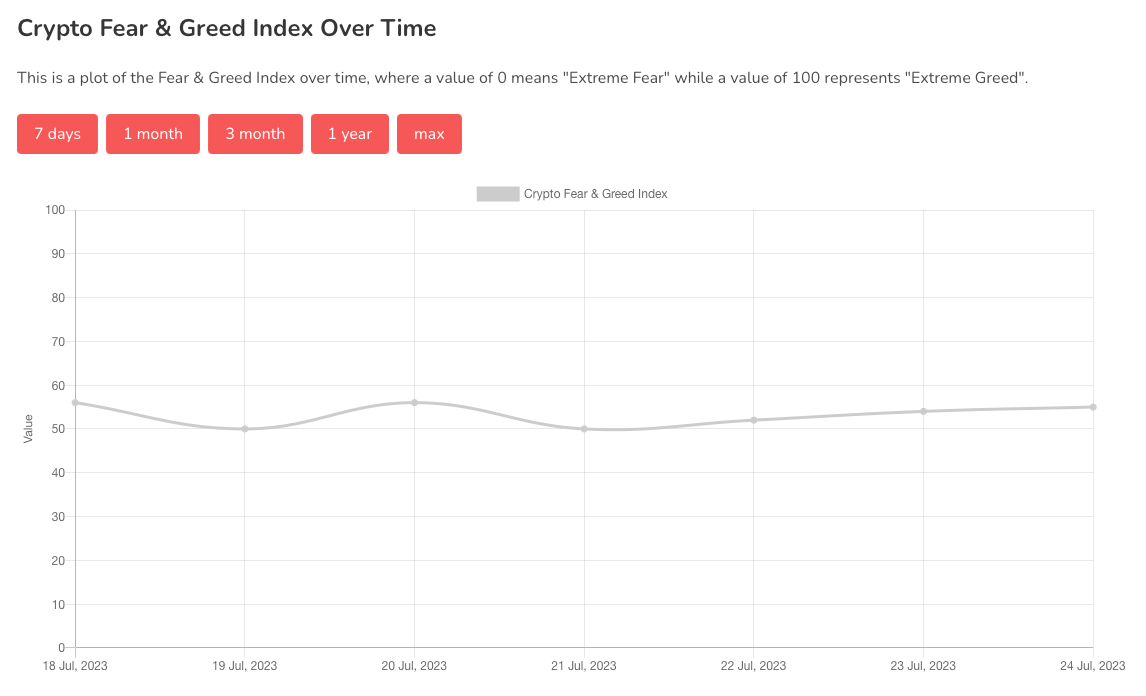
Chart #5 - Fear and Greed Index
The Bitcoin Fear and Greed Index is sitting at 55 today, indicating Greed.
The highest the index has been over the past seven days is 56, and the lowest is 50.
Banter’s Take
The upward pressure on the DXY could create downward pressure on crypto in the short to medium term. However, if crypto consolidates within its current range without breaking down, while the DXY follows its deviation path, this could actually signify strength.
Stay safe my friends!
Go to our Crypto Banter Discord here where Sheldon and Kyle give updates on the charts and trades from The Daily Candle newsletter!