📈📉 BTC Range Breakout: Profit from Bitcoin's Wild Swings Before & After FOMC Meeting!
📈📉 BTC Range Breakout: Profit from Bitcoin's Wild Swings Before & After FOMC Meeting!

Bitget winner - 4292664903
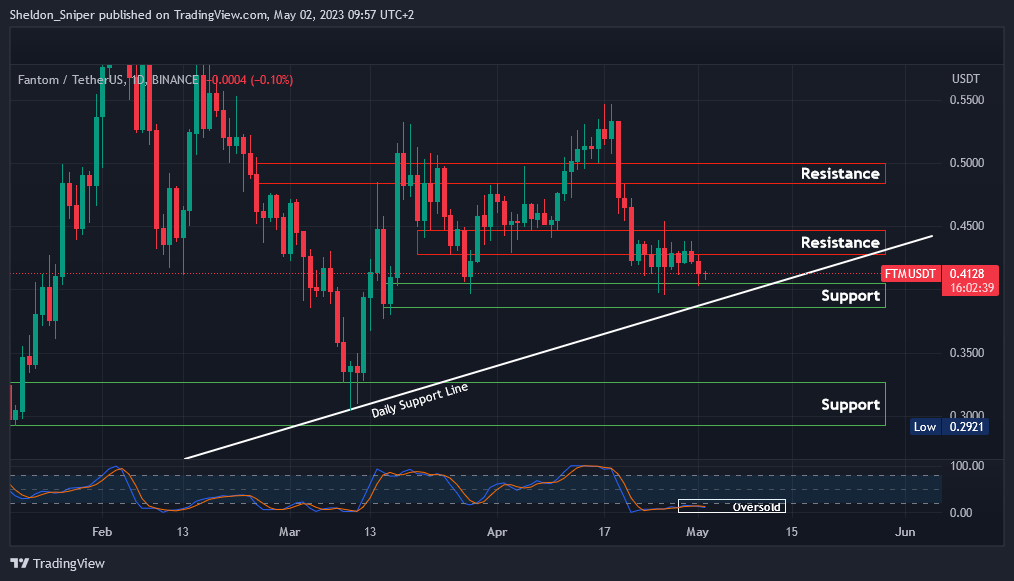
Chart #1 - Fantom (FTMUSDT) 1-Day Chart
Chartist: Sheldon
(For the chart screenshot, click here.)
Over the last few days, FTM found support in the $0.38 - $0.41 zone. But, its Stochastic RSI is oversold on the higher time frames, so a trend reversal could be imminent.
FTM is also sitting near its ascending trend line (on the daily chart), which will provide additional support. If this area is lost, FTM will head to $0.2950 - $0.3350.
If it reverses the trend though, moving higher, the next resistance is at $0.43 - $0.45, followed by $0.485 - $0.50.
𝗣𝗿𝗶𝗺𝗲 𝗫𝗕𝗧
Sign up for a new Trading Account on Prime XBT!
Receive a deposit bonus of up to $7,000 with promo code: SheldonSniper
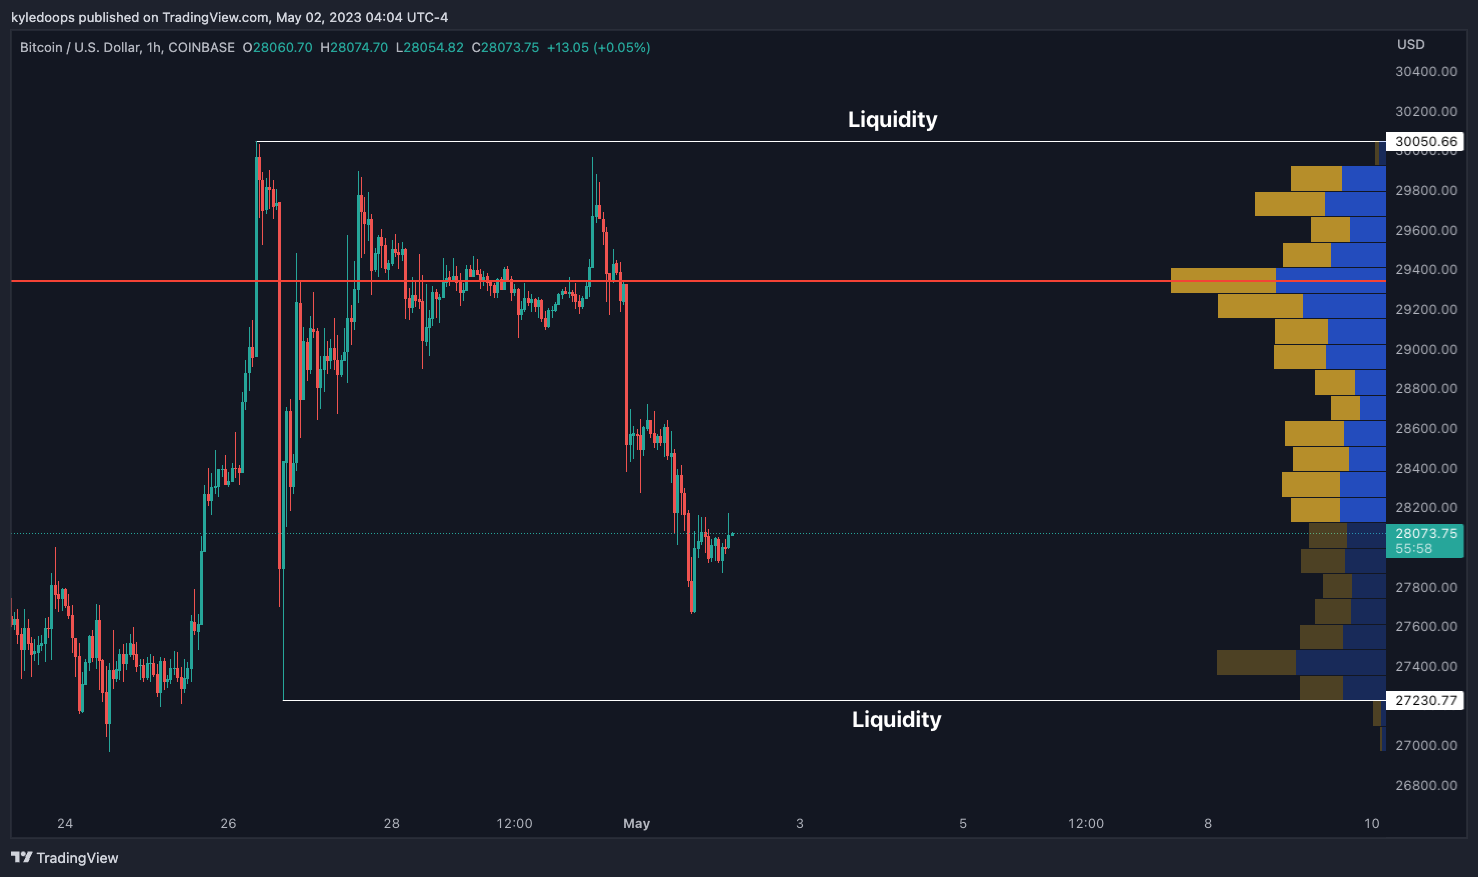
Chart #2 - Bitcoin (BTCUSD) 1-Hour Chart
Chartist: Kyle
(For the chart screenshot, click here.)
Bitcoin has formed a clearly defined range with a high of $30,050 and a low of $27,230 - both loaded with liquidity above and below.
I believe the price will trade between these levels leading right up into the FOMC meeting outcome tomorrow, and I'll have my eyes wide open for a sweep of either the range high or range low to capture that liquidity, matched with a swing failure pattern. A swing failure pattern is essentially when the price looks like it's breaking out of the range, but deviates back in.
Right now, it looks more probable that the range low will be swept, with a reclaim of that level back into the range opening the door for a long trade. However, if the less probable scenario plays out, where we see a sweep of the range high and break back into the range, a short trade opportunity will be presented.
Basically, our eyes are on whichever one comes first.
𝗣𝗿𝗶𝗺𝗲 𝗫𝗕𝗧
Sign up for a new Trading Account on Prime XBT!
Receive a deposit bonus of up to $7,000 with promo code: KyleDoops

Chart #3 - DXY 1-Day Chart
Chartist: Kyle

(For the chart screenshot, click here.)
The DXY could be forming a massive W formation pattern - an incredibly bullish pattern that usually leads to enormous moves.
As long as the DXY is above 100.817, then 103.49 is the first area of interest I have my eyes on. I will re-evaluate the situation once the price gets there.
Claim your Bitget sign-up bonuses here (details below).
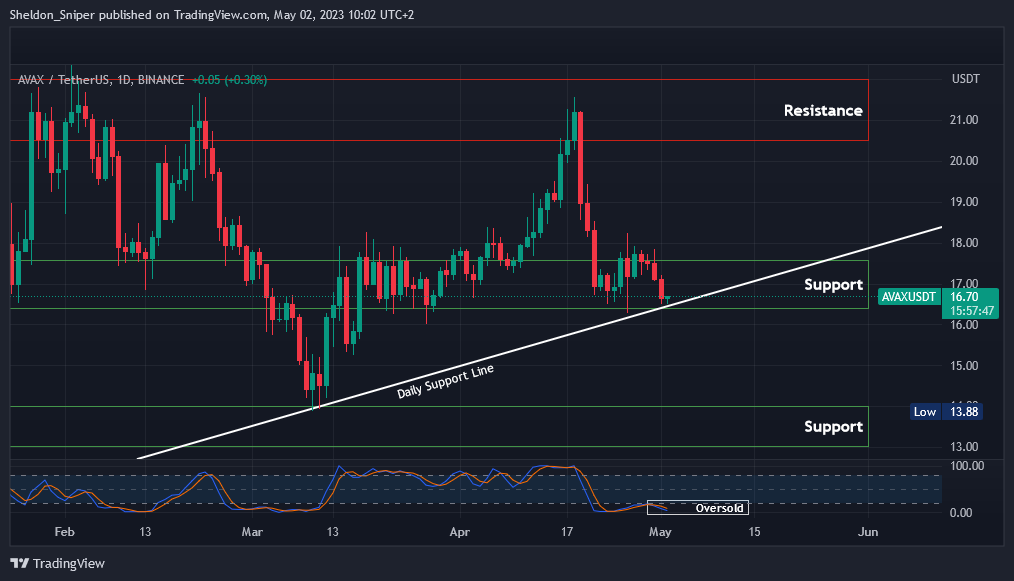
Chart #4 - Avalanche (AVAXUSDT) 1-Day Chart
Chartist: Sheldon
(For the chart screenshot, click here.)
AVAX has been consolidating between $16.50 and $17.50.
Its daily trend line is adding to its support's strength. Meanwhile, its daily Stochastic RSI is oversold. So a trend reversal should soon be expected. That would see AVAX reach $20.50 - $22.00.
If support is lost on the higher time frames, the next critical support is between $13.00 - $14.00.
Claim your Bitget sign-up bonuses here (details below).
Chart #5 - Bitcoin Fear and Greed Index
The Bitcoin Fear and Greed Index is sitting at 55 today, indicating Greed.
The highest the index has been over the past seven days is 64, and the lowest is 55.

Banter’s Take
Many market participants have started to de-risk leading up to the much anticipated two-day FOMC meeting that begins today, which will result in the latest US interest rate being announced tomorrow. Meanwhile, bitcoin is ranging almost 10%, which means big swings are possible.
As for alts, with many at critical support levels, it's a real make-or-break scenario for them.
Stay safe my friends!
Go to our Crypto Banter Discord here where Sheldon and Kyle give updates on the charts and trades from The Daily Candle newsletter!
Bybit winner - 14289192
🔥 Trade to Triumph 🔥
Win a Tesla, Rolex & $10,000 Cash!
Don't miss this extraordinary ByBit trading competition by Crypto Banter & Gareth Soloway! Unleash your trading skills for a chance to win a Tesla, Rolex, and $10,000 cash prizes. Secure your spot in this unrivaled contest now and elevate your crypto trading journey.
Register here to join the elite trader's league!
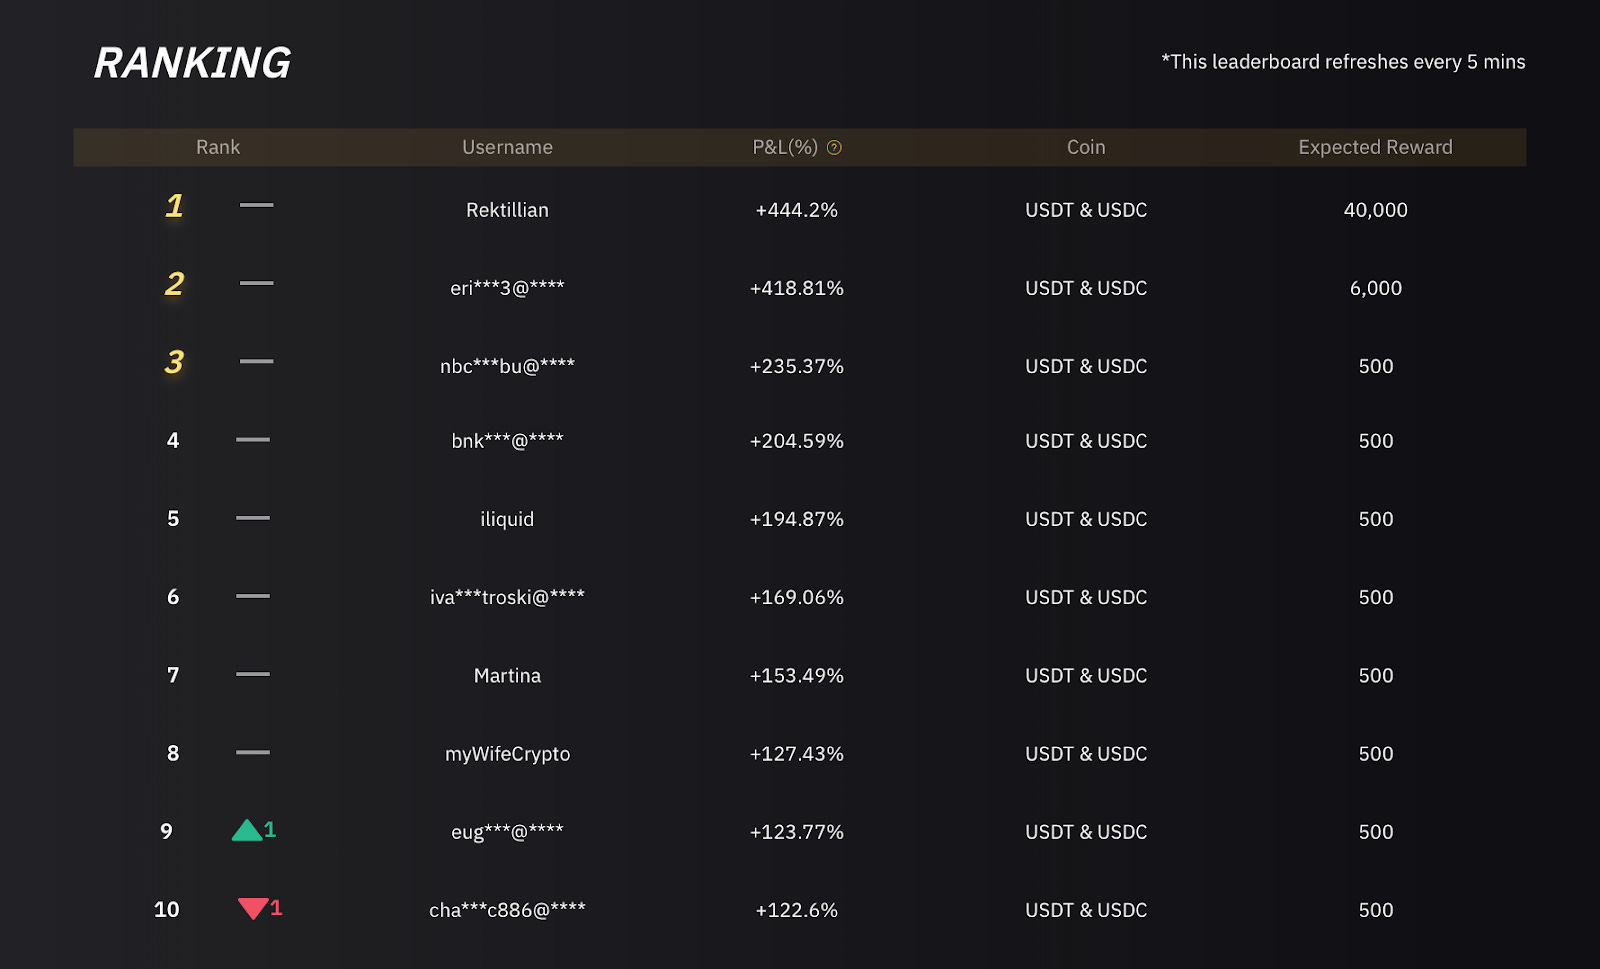
Competition Leaderboard