

📈📉 BTC reclaims 200 Daily and Weekly MA! Is $30,000 NEXT?
📈📉 BTC reclaims 200 Daily and Weekly MA! Is $30,000 NEXT?
PLUS: Fantom (FTM) Trade Setup!
Overview
Chart #1 - Fantom (FTMUSDT) Daily
Chart #2 - Ethereum (ETHUSD) Daily
Chart #3 - Ethereum to Bitcoin Ratio (ETHBTC) Daily
Chart #4 - S&P 500 (SPX) Daily
Chart #5 - Fear and Greed Index

Chart #1 - Fantom (FTMUSDT) Daily
Chartist: Sheldon
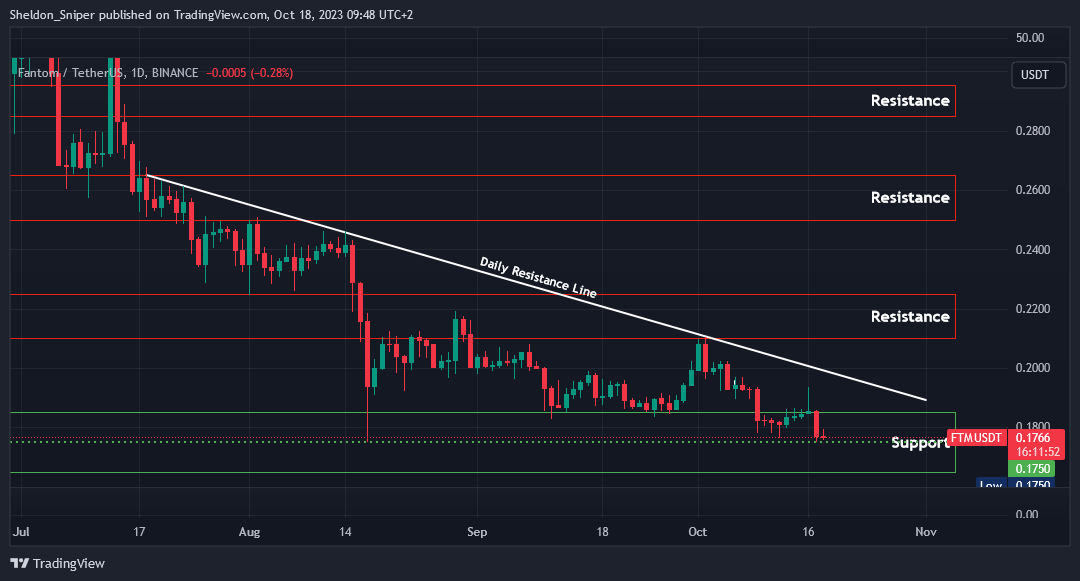
(For the chart screenshot, click here.)
The $0.1750 level is currently holding as major support and the price is once again testing it.
This could present a long trade opportunity which could lead the price to test $0.1850 - $0.20. Given the additional risk in the current market, I would set a tight stop-loss just below $0.1750.
If $0.1750 is lost, the next support is around $0.1650.
Sign-up and trade on Bybit today.
Exclusive $30,000 deposit rewards and bonuses up for grabs!
Chart #2 - Ethereum (ETHUSD) Daily
Chartist: Kyle
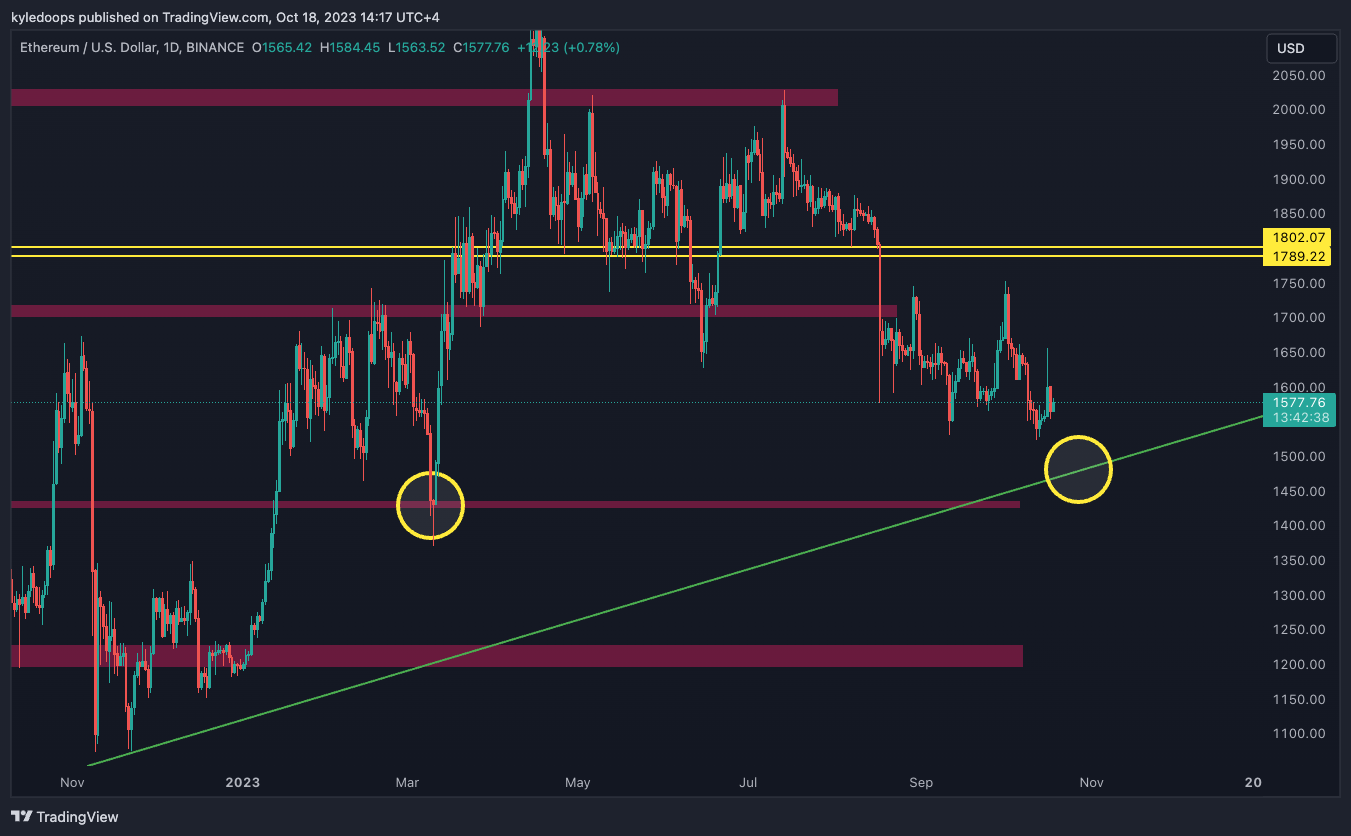
(For the chart screenshot, click here.)
ETH is approaching the area of interest: the $1,500 zone.
This has been a long-time target, especially with ETH/BTC finally breaking down to the range low support.
Watch this level for a potential bounce. If it loses this diagonal, then the $1,400 support is the next target.
Claim your Bitget sign-up bonuses here (details below).
Chart #3 - Ethereum to Bitcoin Ratio (ETHBTC) Daily
Chartist: Kyle
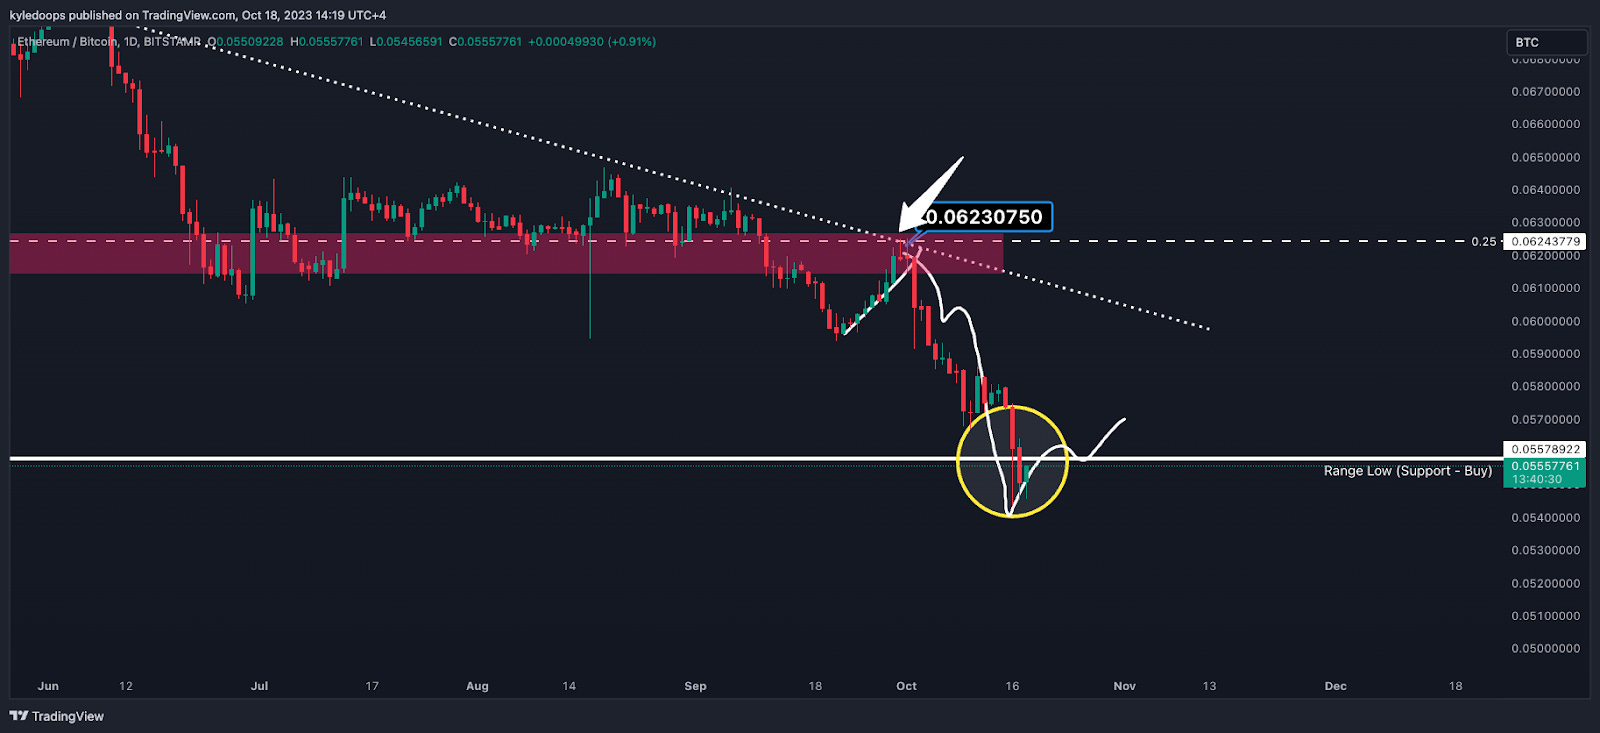
(For the chart screenshot, click here.)
ETH/BTC could be looking to reclaim this level and break back into the range.
If it does this, then expect ETH, as shown on the chart above, to simultaneously bounce.
Claim your Bitget sign-up bonuses here (details below).
Chart #4 - S&P 500 (SPX) Daily
Chartist: Sheldon
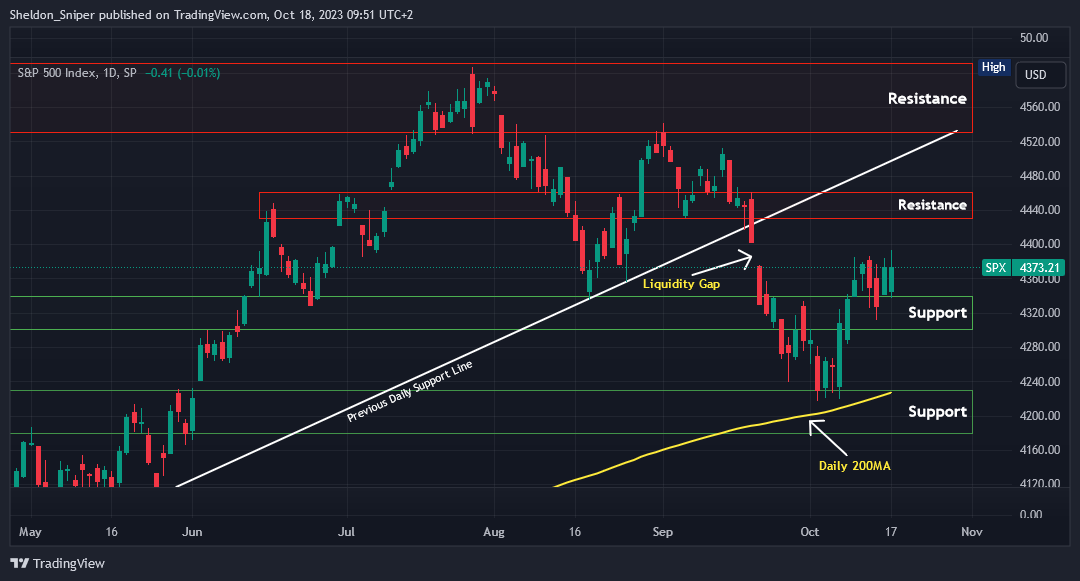
(For the chart screenshot, click here.)
The SPX has been ranging and consolidating between the 4,340 level of support and the 4,385 area.
It still has not closed the liquidity gap that formed when the SPX closed on 20th September at 4,400 and reopened on 21st September at 4,375. I feel that both the DXY and 10YR Yield are due for a small correction, which could result in the SPX moving higher, testing the next area of resistance at 4,430 – 4,460.
Claim your Bitget sign-up bonuses here (details below).
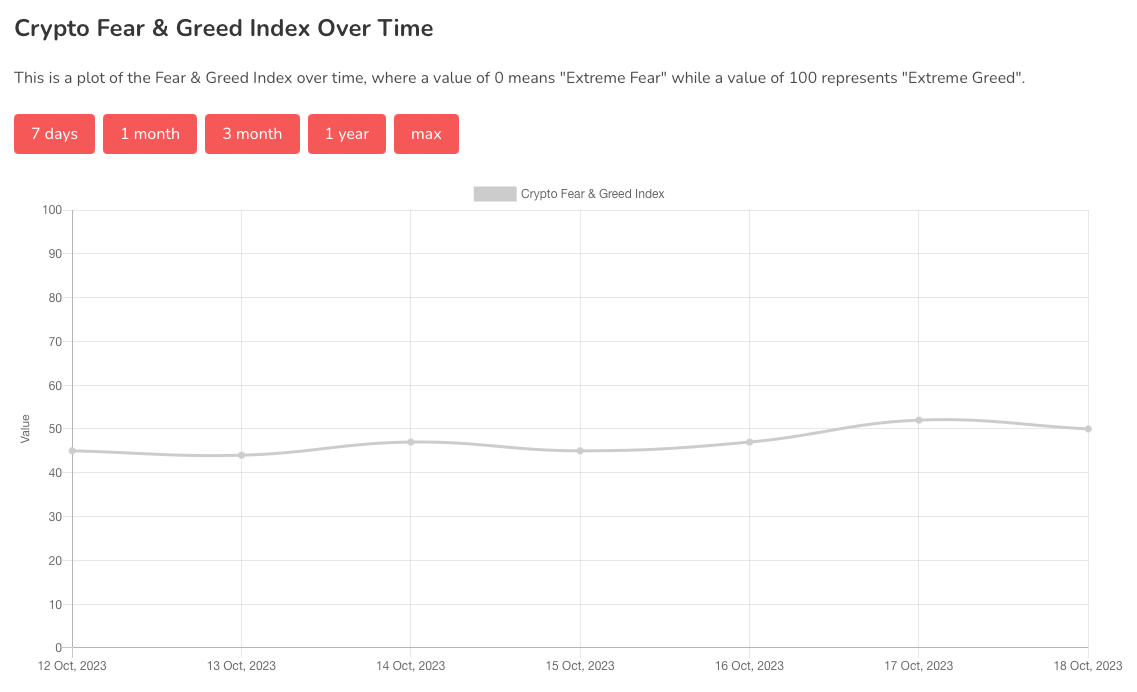
Chart #5 - Fear and Greed Index
The Fear and Greed Index is sitting at 50 today, Neutral.
The highest the index has been over the past seven days is 52, and the lowest is 44.
Banter’s Take
BTC has reclaimed the 200 daily and 200 weekly MA. The next target to take out is $30,000, which would mean getting above the breakdown level from 3 months ago. This would be a strong sign that the correction is finally over.
Stay safe my friends!
Go to our Crypto Banter Discord here where Sheldon and Kyle give updates on the charts and trades from The Daily Candle newsletter!