

📈📉 BTC Retracement to $32k BEGINS?!
📈📉 BTC Retracement to $32k BEGINS?!
PLUS: THORChain (RUNE) Long Trade Setup!
Overview
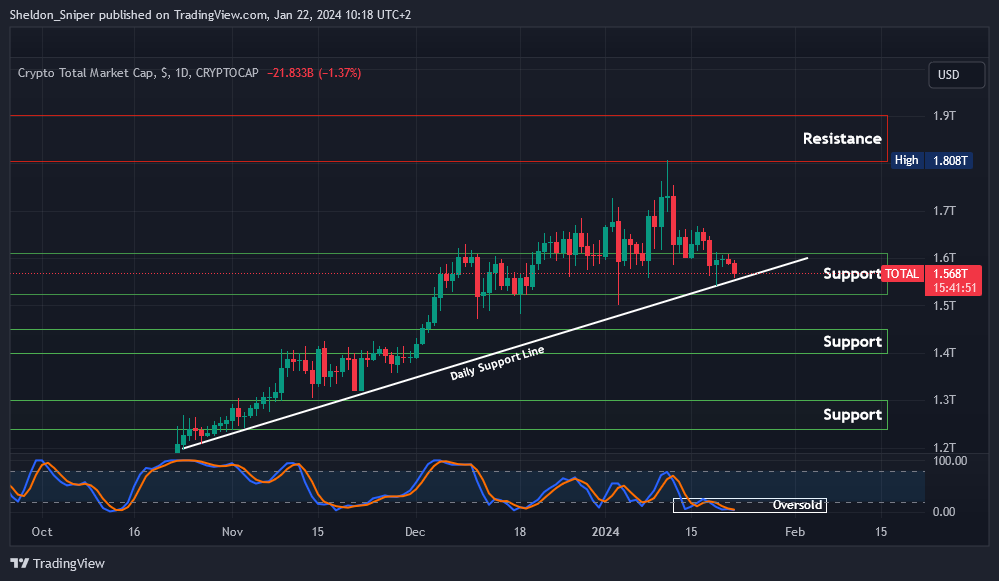
Chart #1 - Crypto Total Market Cap (TOTAL) Daily
Chart #2 - Bitcoin (BTCUSD) Weekly
Chart #3 - Ethereum to Bitcoin Ratio (ETHBTC) Daily
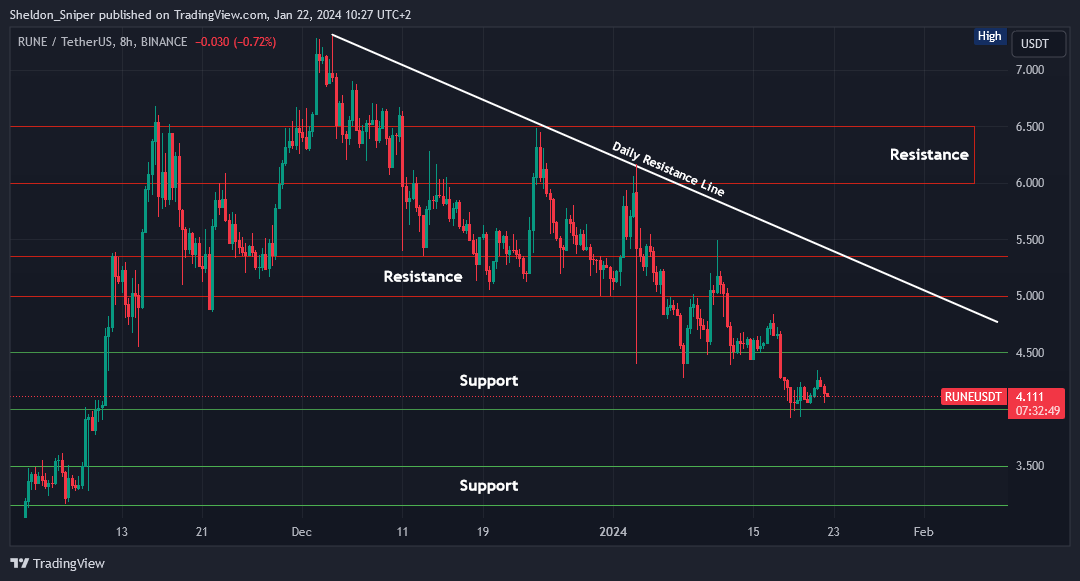
Chart #4 - THORChain (RUNEUSDT) 8-Hour
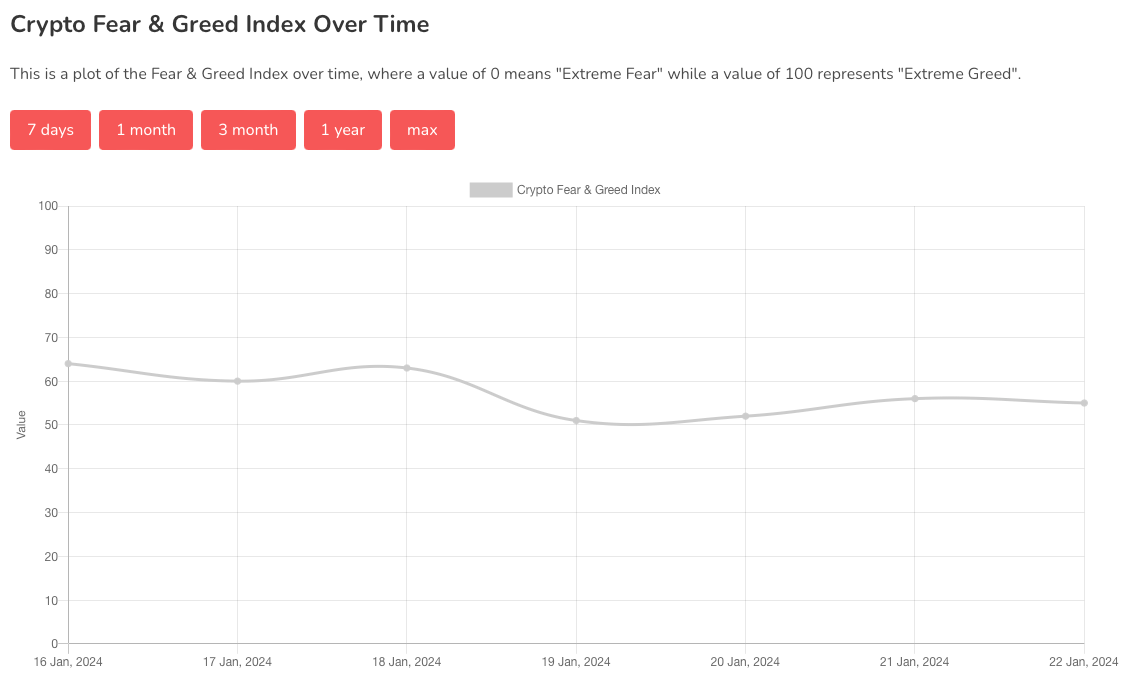
Chart #5 - Fear and Greed Index
Chart #1 - Crypto Total Market Cap (TOTAL) Daily
Chartist: Sheldon
(For the chart screenshot, click here.)
The $1.55 trillion level is currently serving as support.
The market is oversold. If the $1.52 trillion - $1.56 trillion area can hold as support, there's a potential for the market to move higher, trapping short sellers, and testing the next resistance area at $1.80 trillion - $1.90 trillion.
This range was last tested two weeks ago.
Sign-up and trade on Bybit today.
Exclusive $30,000 deposit rewards and bonuses up for grabs!
Chart #2 - Bitcoin (BTCUSD) Weekly
Chartist: Kyle

(For the chart screenshot, click here.)
Bitcoin has faced challenges over the past two weeks, with its RSI dropping and the Stochastic RSI indicating significant downward momentum on the weekly timeframe.
The critical question is not just whether it can hold the $40,135 level, but whether it will reach as low as $32,000 to test support and begin forming a structure for the next upward phase.
Additionally, the price is once again below the 50-day moving average (MA) on the daily chart, signaling the likely start of a retracement.
Claim your Bitget sign-up bonuses here (details below).

Outsmart 99% Of The Market!
Get full access into our Discord And Telegram group, where you'll find all of our premium content!
👉 Trade Signals!
👉 Trade Set-Ups!
👉 Trading Challenges!
👉 Education!
👉 SO MUCH MORE!
Chart #3 - Ethereum to Bitcoin Ratio (ETHBTC) Daily
Chartist: Kyle

(For the chart screenshot, click here.)
The past week saw ETH outperforming BTC, but it's important to consider if this trend has come to an end.
From a technical perspective, the current level is displaying signs of weakening, including wicks above indicating a slowdown and failure to break the previous lower high. The question now is whether ETH will shift and target a new lower low.
The key levels to monitor are 0.06267 for a potential breakout above and 0.04905 for a potential breakdown below.
If Bitcoin targets $33,000 and even $32,000 in the coming days to retest support/resistance, ETH might print a consolidation pattern on this chart.
Claim your Bitget sign-up bonuses here (details below).
Chart #4 - THORChain (RUNEUSDT) 8-Hour
Chartist: Sheldon
(For the chart screenshot, click here.)
RUNE has reached the bottom of the $4.00 - $4.50 support area, currently trading at $4.00. A bounce may come soon…
I’m taking a spot long trade on it.
I’m making a gradual entry at this level, with a stop loss set at $3.80 and a take profit target at the next resistance area of $5.00 - $5.40.
This range also coincides with the daily descending resistance line from early December. Monitoring for a possible rejection in this area will be important, but if the price manages to break through that resistance line on higher timeframes, I might hold onto my position, and only sell if it reaches the next area of resistance at $6.00 - $6.50.
Claim your Bitget sign-up bonuses here (details below).
Chart #5 - Fear and Greed Index
The Fear and Greed Index is sitting at 55 today, indicating Greed.
The highest the index has been over the past seven days is 64, and the lowest is 51.
Banter’s Take
A new day, a new week, and the whole crypto market is slowly bleeding. If Bitcoin loses $40,135, the next support is at $37,300, followed by $35,500. This will give even more short-term opportunities for shorts. Be extra careful not to get trapped in these trades for a long time.
Stay safe my friends!
Go to our Crypto Banter Discord here where Sheldon and Kyle give updates on the charts and trades from The Daily Candle newsletter!