

📈📉 BTC Reversal Below THIS Level!
📈📉 BTC Reversal Below THIS Level!
PLUS: BNB Major PUMP Incoming?
Overview
Chart #1 - Bitcoin (BTCUSDT) Daily
Chart #2 - THORChain (RUNEUSDT) Daily
Chart #3 - BNB (BNBUSDT) Daily
Chart #4 - Polkadot (DOTUSDT) Daily
Chart #5 - Fear and Greed Index
Chart #1 - Bitcoin (BTCUSDT) Daily
Chartist: Sheldon
(For the chart screenshot, click here.)
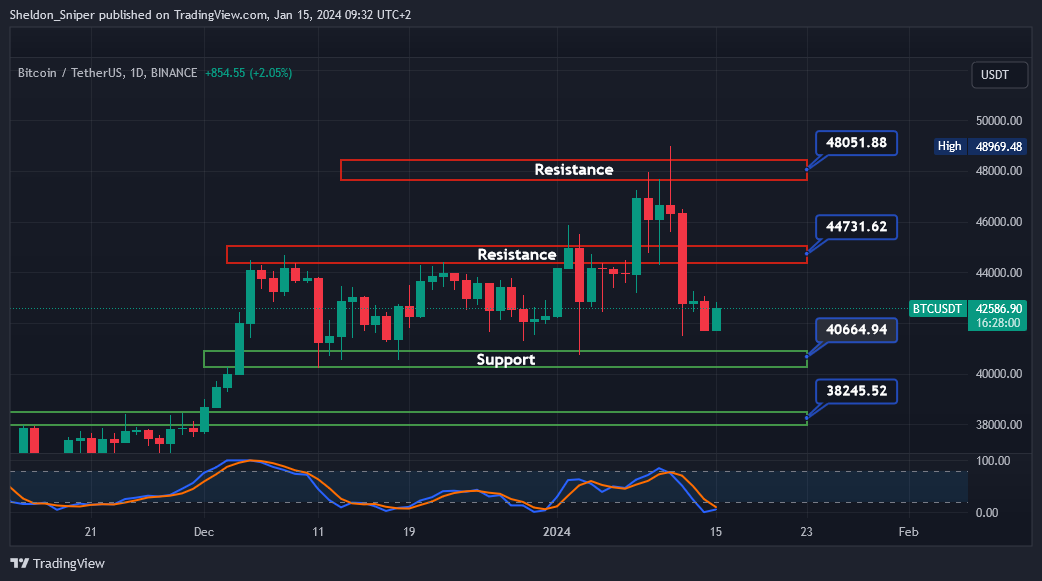
On Friday, BTC retraced from around $46,300 down to $40,800 before finding support, currently trading at $42,600.
I anticipate BTC moving to the upside in the next day or two, with the next resistance at $44,300 - $44,800, or even at the smaller resistance level around $46,000.
Cash should start flowing into the general altcoin market during this time, where I expect some of the alts to outperform BTC. If BTC continues to retrace, the next major support areas are at $40,100 - $40,700, and after that at $38,000 - $38,300.
Sign-up and trade on Bybit today.
Exclusive $30,000 deposit rewards and bonuses up for grabs!
Chart #2 - THORChain (RUNEUSDT) Daily
Chartist: Kyle
(For the chart screenshot, click here.)
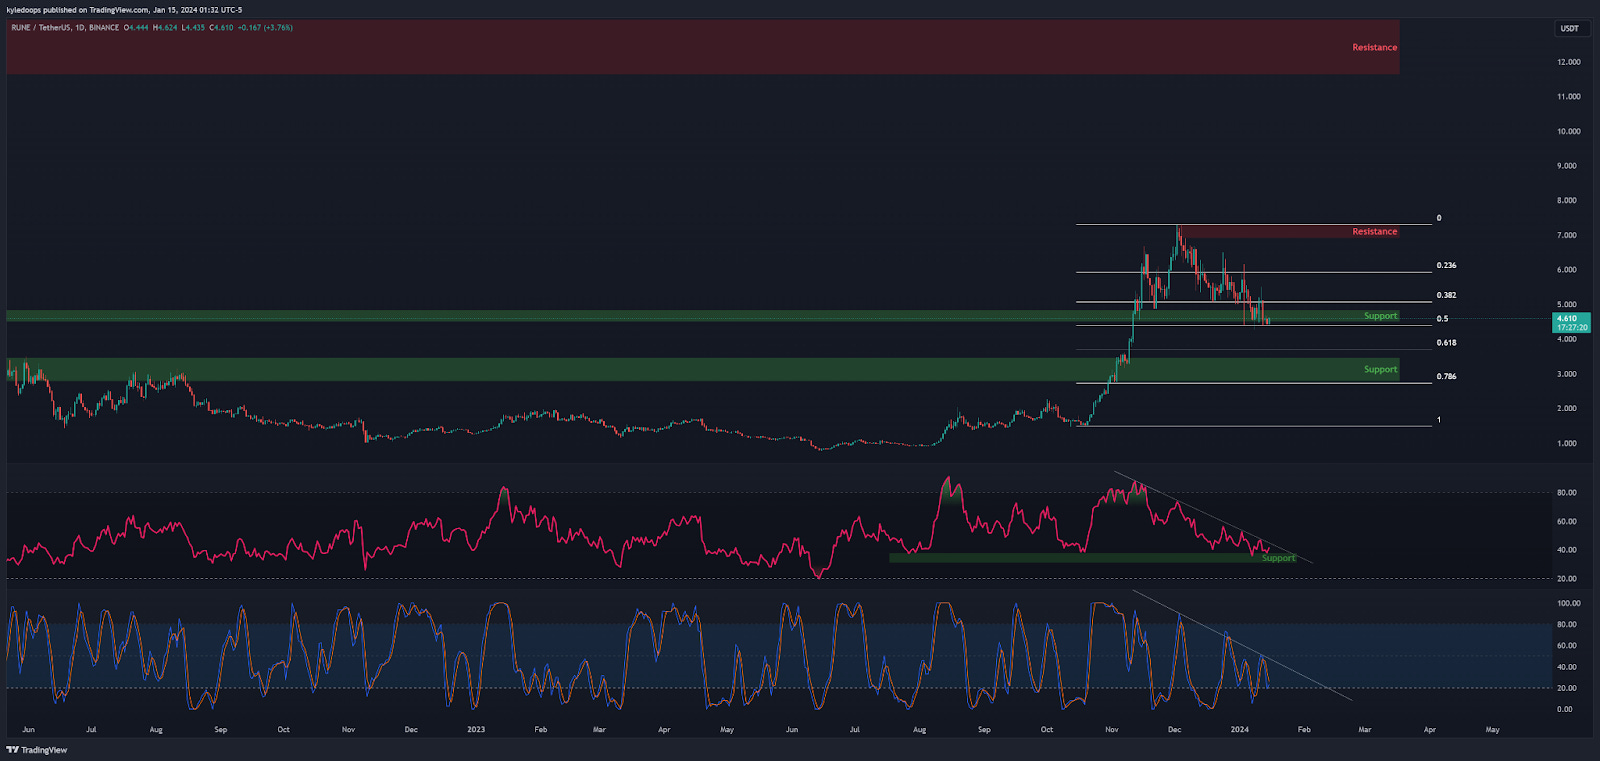
Did RUNE find support from its correction to the 0.5 Fib Level at $4.40?
The RSI seems to have held onto the same support for the past six months, as the Stochastic RSI is also approaching the oversold region.
Let's see if it builds structure in the coming days, and we can plan a long trade very soon. In case it goes lower, the next support is between $3.60 and $3.20 within the golden zone.
Claim your Bitget sign-up bonuses here (details below).

Outsmart 99% Of The Market!
Get full access into our Discord And Telegram group, where you'll find all of our premium content!
👉 Trade Signals!
👉 Trade Set-Ups!
👉 Trading Challenges!
👉 Education!
👉 SO MUCH MORE!
Chart #3 - BNB (BNBUSDT) Daily
Chartist: Kyle
(For the chart screenshot, click here.)
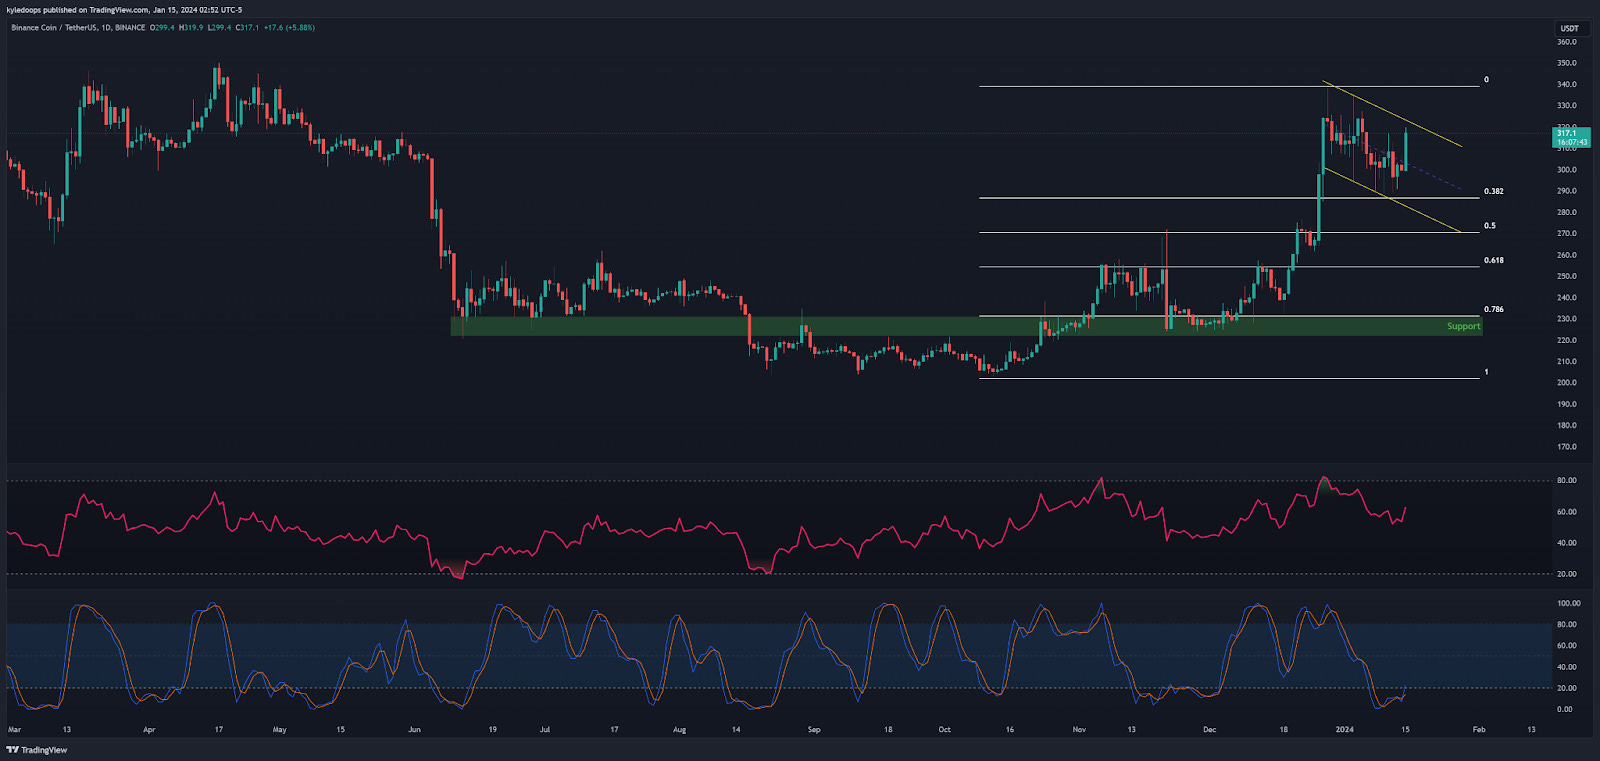
BNB is bouncing multiple times on the 0.382 Fib Level at $290, but is it strong enough to break the flag?
There is a Fair Value Gap between $285 and $269. It's advisable to pay close attention to the mentioned levels before entering a trade.
Support areas are $254 and $222. However, if it breaks the bull flag, the next resistance is at $350, followed by $430.
Claim your Bitget sign-up bonuses here (details below).
Chart #4 - Polkadot (DOTUSDT) Daily
Chartist: Sheldon
(For the chart screenshot, click here.)
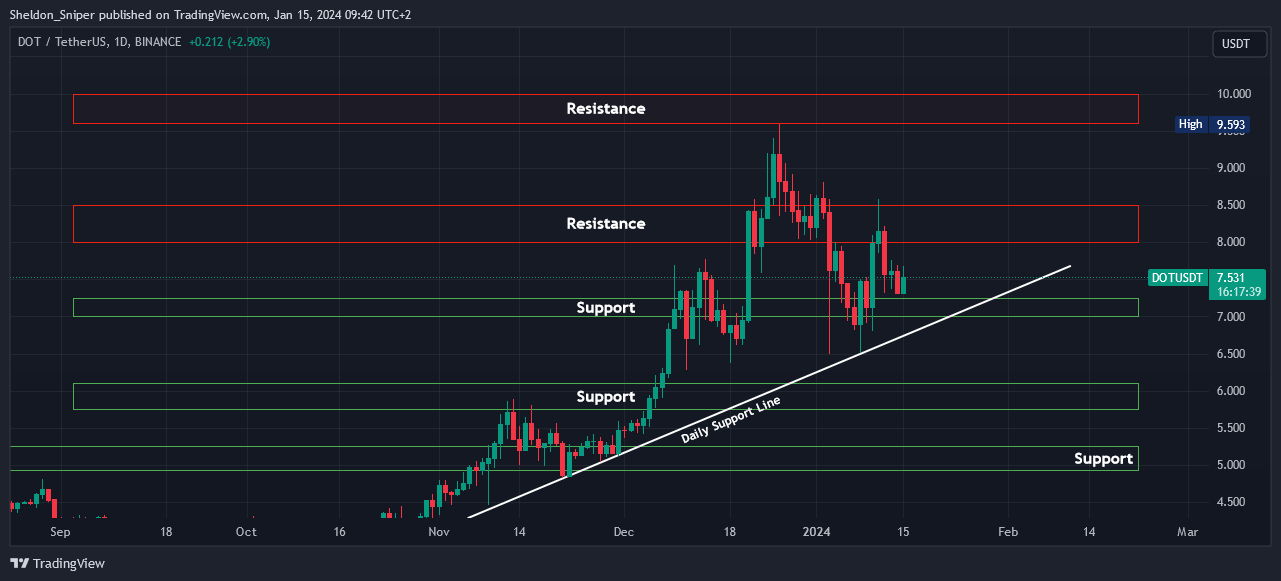
Over the last three weeks, DOT has retraced from $9.60 down to its current trading price of $7.53.
There is a current support area at $7.00 - $7.25, and if the price of BTC stabilizes or starts moving back up, I expect DOT to test the $8.00 - $8.50 resistance area again.
Claim your Bitget sign-up bonuses here (details below).
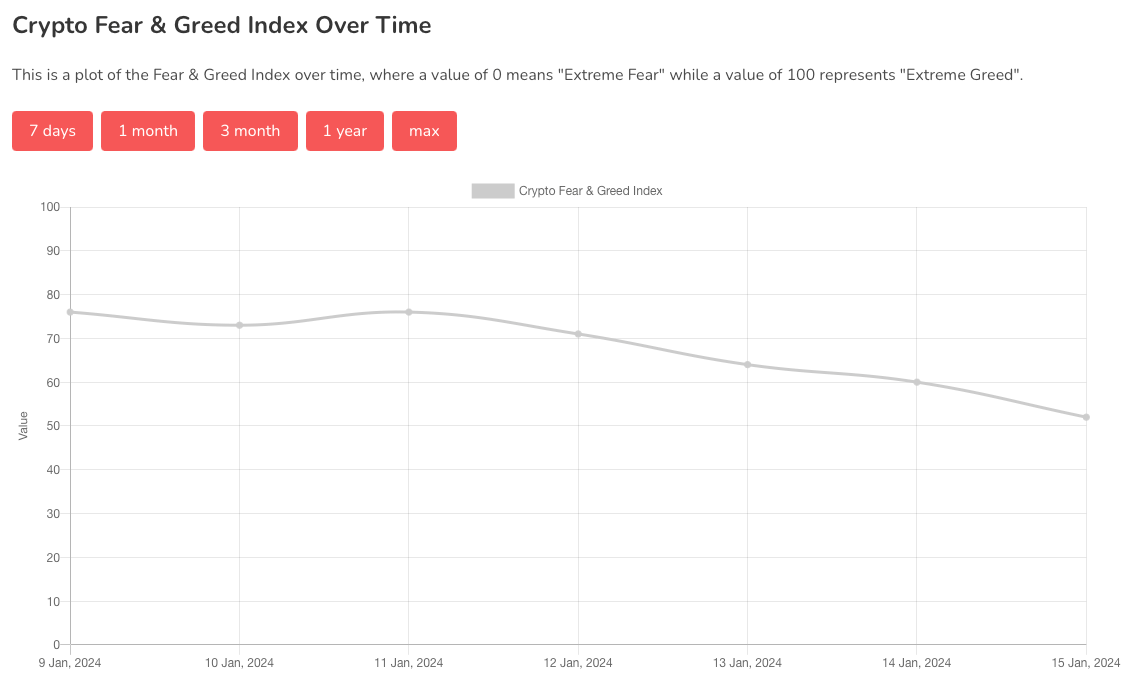
Chart #5 - Fear and Greed Index
The Fear and Greed Index is sitting at 52 today, Neutral.
The highest the index has been over the past seven days is 76, and the lowest is 52.
Banter’s Take
Bitcoin's weakness and the potential for a reversal if it drops below $40,200 could provide an opportunity for altcoins. Ethereum has broken the $2,400 level and now needs to maintain it. Expect lower trading volume in the US market sessions today due to Martin Luther King Day.
Stay safe my friends!
Go to our Crypto Banter Discord here where Sheldon and Kyle give updates on the charts and trades from The Daily Candle newsletter!