

📈📉 BTC Short Trade + Dominance BREAKOUT!
📈📉 BTC Short Trade + Dominance BREAKOUT!

Overview
Chart #1 - USDT Dominance (USDT.D) 3-Day
Chart #2 - Bitcoin (BTCUSD) Hourly
Chart #3 - Bitcoin Dominance (BTC.D) Weekly
Chart #4 - US Government Bonds 10 Year Yield (TNX) Daily
Chart #5 - Fear and Greed Index

Chart #1 - USDT Dominance (USDT.D) 3-Day
Chartist: Sheldon
(For the chart screenshot, click here.)
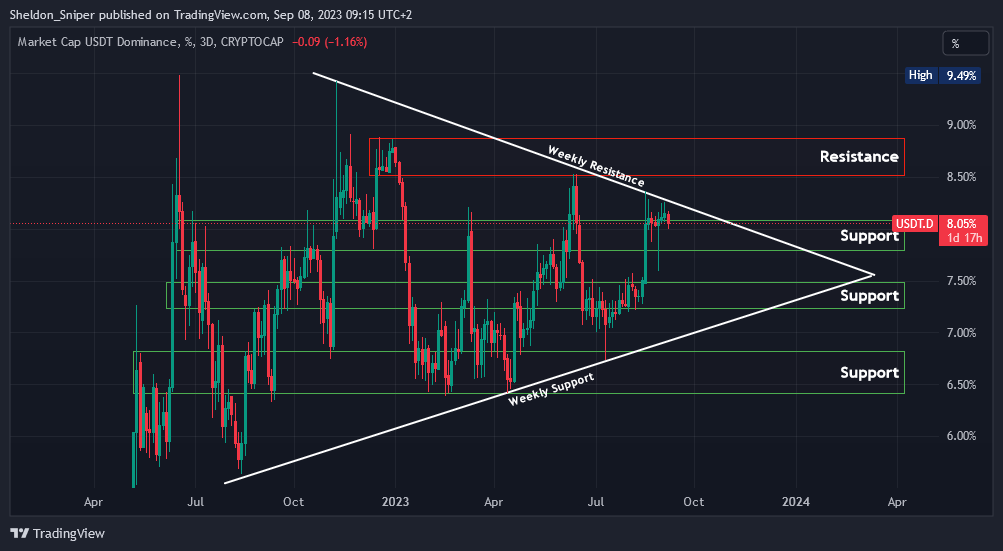
Over the past year, USDT.D has formed a massive bullish pennant!
This past week, it tested the upper weekly descending resistance line multiple times.
Now, a positive breakthrough at around 8.20% could elevate the dominance to 8.50% - 8.90%.
𝗣𝗿𝗶𝗺𝗲 𝗫𝗕𝗧
Sign up for a new Trading Account on Prime XBT!
Receive a deposit bonus of up to $7,000 with promo code: SheldonSniper
Sign-up and trade on Bybit today.
Exclusive $30,000 deposit rewards and bonuses up for grabs!
Chart #2 - Bitcoin (BTCUSD) Hourly
Chartist: Kyle
(For the chart screenshot, click here.)
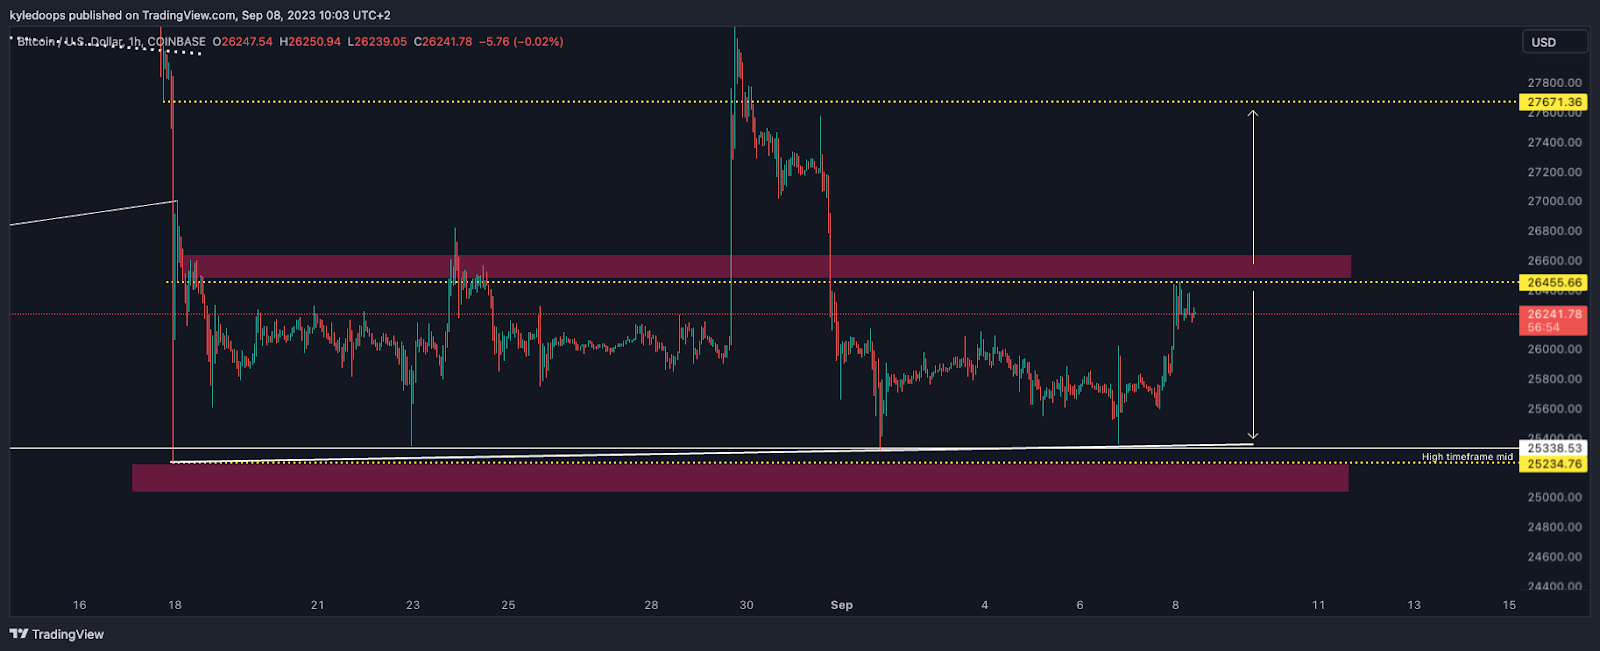
Bitcoin is currently confined within a narrow range, and the strategy is to approach it level by level.
The defined ranges are $25,235 - $26,455 and then $26,455 - $27,671.
The price has touched the mid-level, and now my inclination is to short down to the bottom of the range. This would change if the price surpasses and consolidates above the mid-level.
𝗣𝗿𝗶𝗺𝗲 𝗫𝗕𝗧
Sign up for a new Trading Account on Prime XBT!
Receive a deposit bonus of up to $7,000 with promo code: KyleDoops
Chart #3 - Bitcoin Dominance (BTC.D) Weekly
Chartist: Kyle
(For the chart screenshot, click here.)
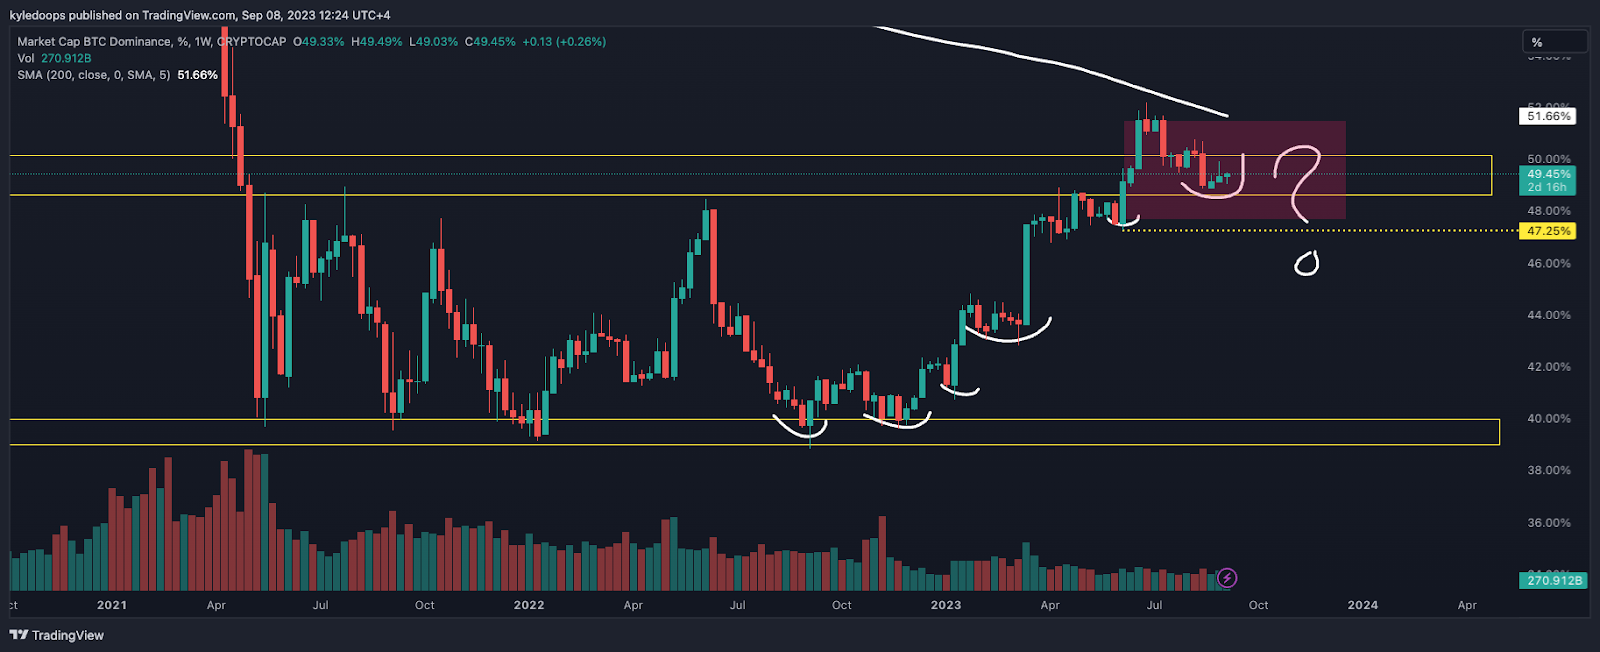
Bitcoin dominance has broken out on the weekly chart and is currently at an indecision point (indicated by the pink highlighted area).
A break above the downward-sloping white 200-week MA will confirm the breakout range for Bitcoin dominance, suggesting that this movement was merely a retest.
A drop below the 47.25% level would signal that dominance is reverting back into the previous range.
Claim your Bitget sign-up bonuses here (details below).
Chart #4 - US Government Bonds 10 Year Yield (TNX) Daily
Chartist: Sheldon
(For the chart screenshot, click here.)
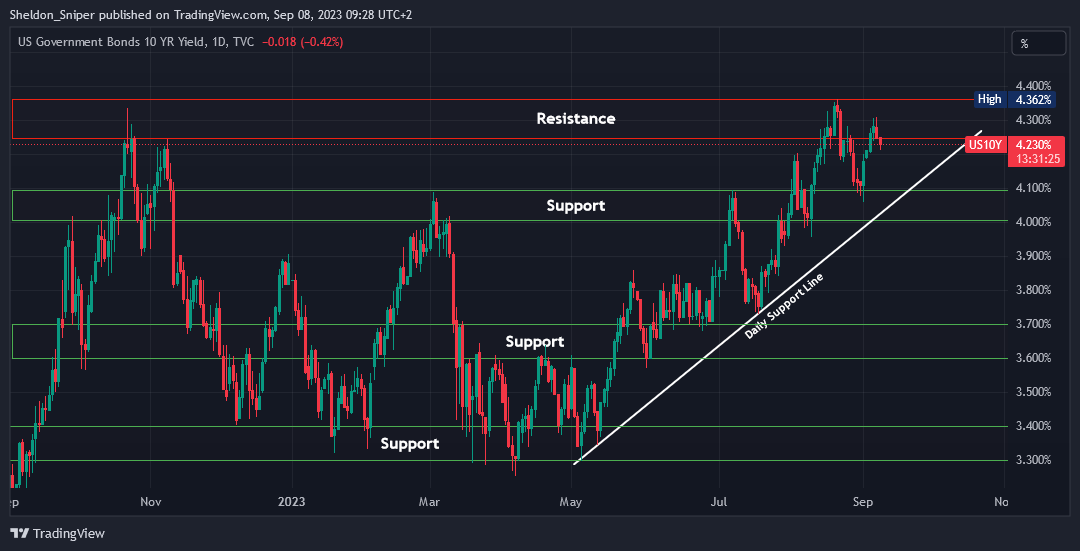
The US 10YR Yield might continue to retrace to 4.10%, an area last tested at the end of August.
If there's more downside for both the US 10YR Yield and the DXY, it should be positive for the markets. I'd like to see the 10YR range between 4.10% - 4.30%.
However, if it breaks the major 4.25% - 4.35% resistance and spikes up rapidly, that would be extremely bearish for risk-on assets.
Claim your Bitget sign-up bonuses here (details below).
Chart #5 - Fear and Greed Index
The Fear and Greed Index is sitting at 46 today, indicating Fear.
The highest the index has been over the past seven days is 46, and the lowest is 39.

Banter’s Take
If Bitcoin manages to consolidate above $26,000, there's a possibility that bulls might attempt to breach the $27,000 mark. If they can successfully surpass and maintain the price above that level, bullish momentum might intensify significantly.
Otherwise, the risk tilts downward, and we can expect lower prices.
Stay safe my friends!
Go to our Crypto Banter Discord here where Sheldon and Kyle give updates on the charts and trades from The Daily Candle newsletter!