

📈📉 BTC Surge Incoming! + Is RNDR a Buy?
📈📉 BTC Surge Incoming! + Is RNDR a Buy?

Overview
Chart #1 - THORChain (RUNEUSDT) Daily Chart
Chart #2 - Bitcoin (BTCUSD) 3-Day Chart
Chart #3 - Ethereum to Bitcoin Ratio (ETHBTC) Daily Chart
Chart #4 - Render (RNDRUSDT) Daily Chart
Chart #5 - Fear and Greed Index

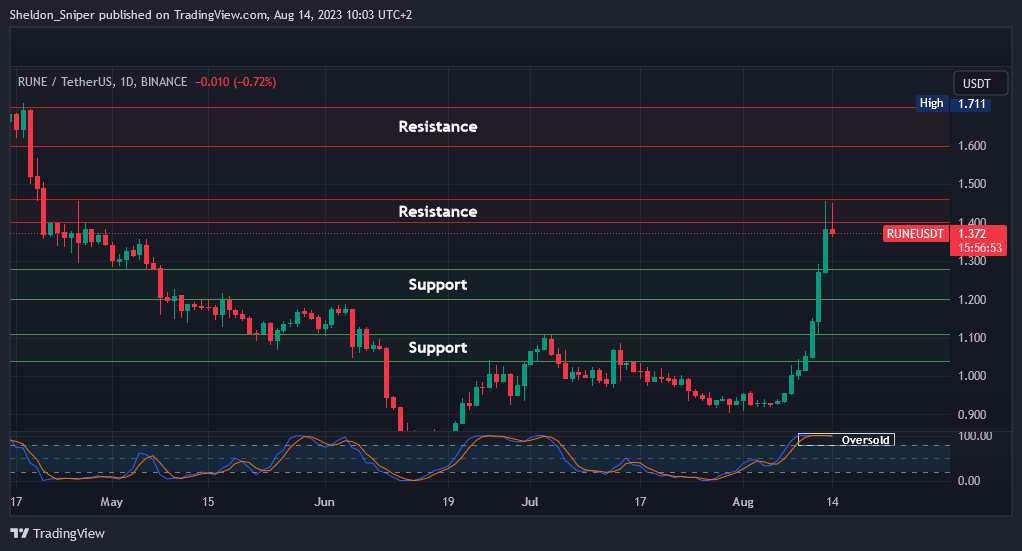
Chart #1 - THORChain (RUNEUSDT) Daily Chart
Chartist: Sheldon
(For the chart screenshot, click here.)
Over the last ten days, RUNE has rallied by a massive 60%.
The price moved from around $0.90 at the beginning of the month to yesterday's high of $1.48. Price is currently trading at $1.37, is oversold on the daily time frame, and is within the $1.40 - $1.48 area of resistance. I expect a retrace in price following this massive move, possibly testing the next areas of support at $1.20 - $1.28. This is the same area where the daily 200MA can be found, which will also act as additional support.
To the upside, if $1.48 is breached, the next resistance to watch is at $1.60 - $1.70.
Sign-up and trade on Bybit today.
Exclusive $30,000 deposit rewards and bonuses up for grabs!
Chart #2 - Bitcoin (BTCUSD) 3-Day Chart
Chartist: Kyle

(For the chart screenshot, click here.)
According to the Hash Ribbons indicator, a Bitcoin buy signal has flashed, so Bitcoin miners are profitable once more.
So the current consolidation phase might soon conclude, and the price should make another upward move. This could create the next higher low in the market, and traders might begin targeting a break above the $32,000 level.
Historically, once the Bitcoin buy signal appears, it boasts a high success rate and rarely dips below the previous buy signal's low.
So, the bottom is likely established.
𝗣𝗿𝗶𝗺𝗲 𝗫𝗕𝗧
Sign up for a new Trading Account on Prime XBT!
Receive a deposit bonus of up to $7,000 with promo code: KyleDoops
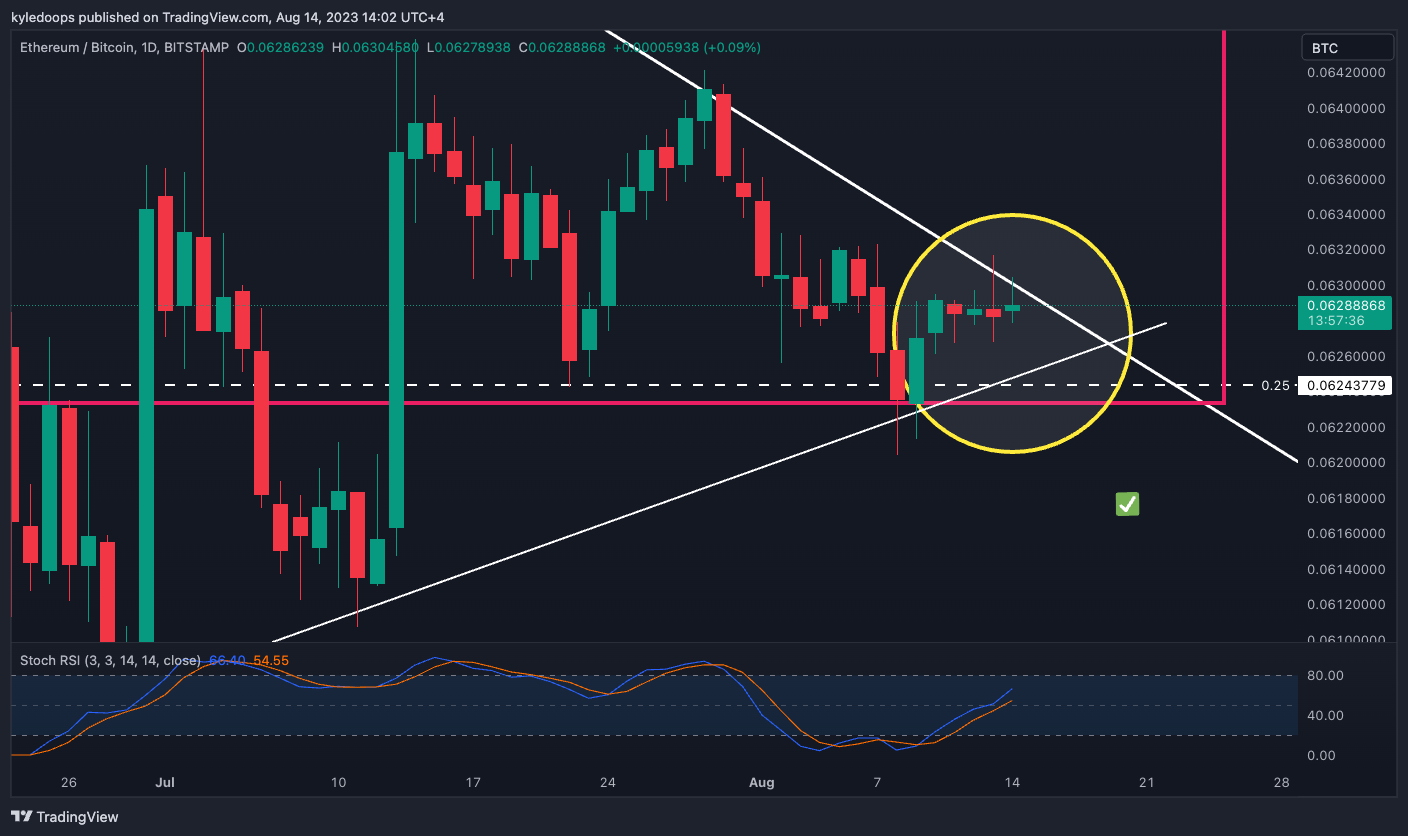
Chart #3 - Ethereum to Bitcoin Ratio (ETHBTC) Daily Chart
Chartist: Kyle
(For the chart screenshot, click here.)
The ETH/BTC chart is approaching the apex of this triangle, so a decision will likely be made within the next week, if not sooner.
Presently, there's selling pressure at this trend line. A breach of the lower trend line, combined with a sustained position below the 0.25 dashed line, would confirm a downward break. If this occurs, the ETH/BTC pair is likely to trend lower in the upcoming days.
But, a break above the downward-sloping trend line would mean that altcoins might begin to attract bids.
Claim your Bitget sign-up bonuses here (details below).
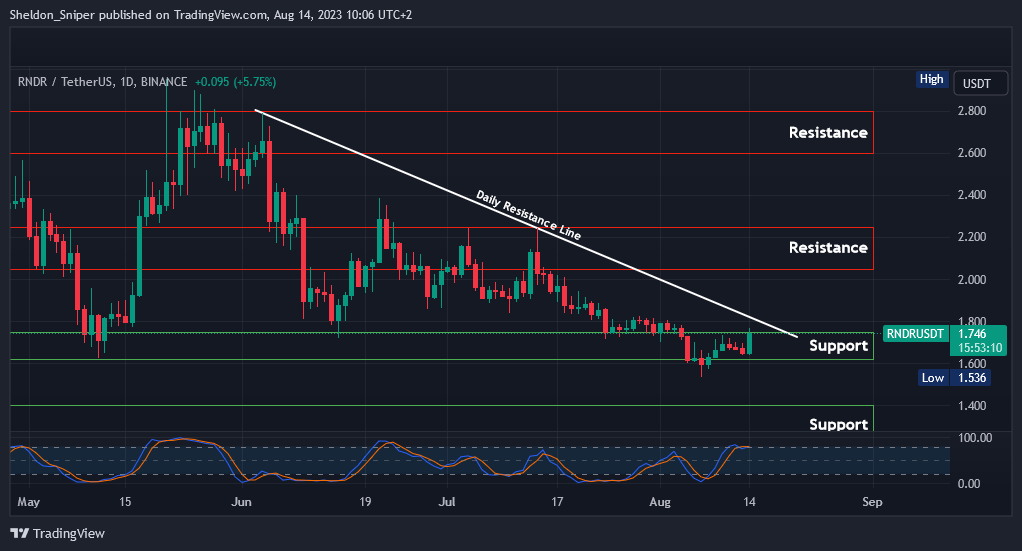
Chart #4 - Render (RNDRUSDT) Daily Chart
Chartist: Sheldon
(For the chart screenshot, click here.)
RNDR has been consolidating in the $1.60 - $1.75 support area for the past week and is overbought on the daily time frame.
It's not a buy yet, but the price is nearing the daily descending resistance line that originates from the beginning of June. If there's a break and retest of the daily resistance line at around $1.80, I might consider a long trade from there.
The daily 200MA is also around the $1.80 mark, so the price would need to settle above that MA to be considered a buy. The subsequent resistance area is at $2.05 - $2.25.
If the price breaks the $1.60 level to the downside, it might be a short trade opportunity to the next support area at $1.20 - $1.40.
Claim your Bitget sign-up bonuses here (details below).
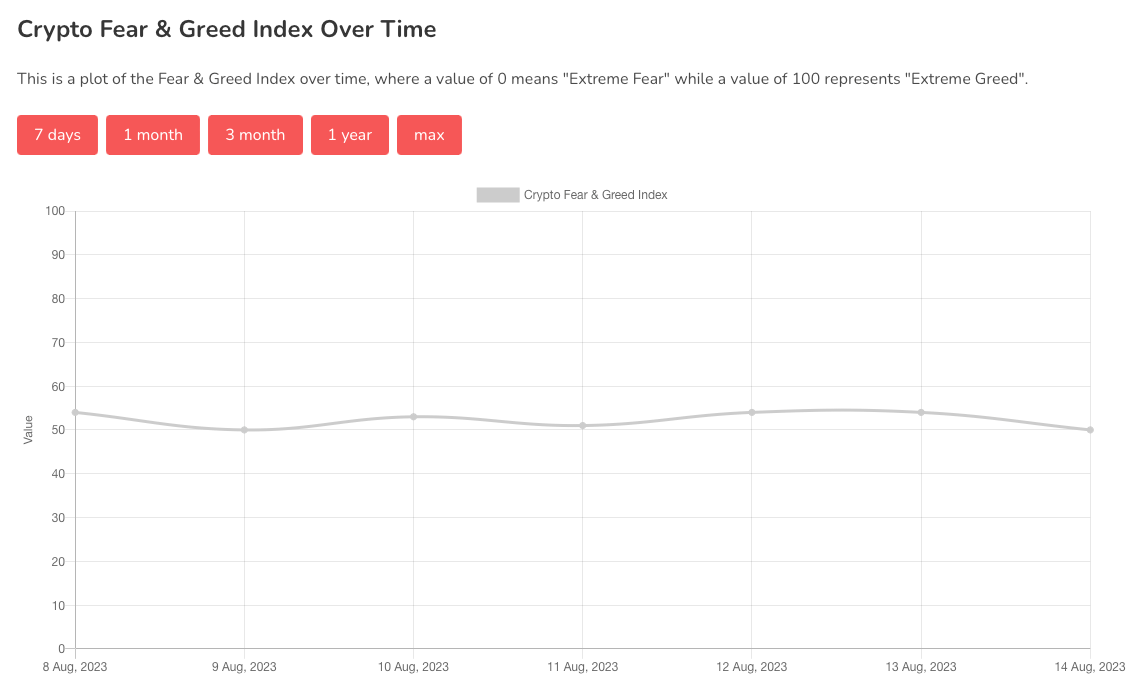
Chart #5 - Fear and Greed Index
The Fear and Greed Index is sitting at 50 today, Neutral.
The highest the index has been over the past seven days is 54, and the lowest is 50.
Banter’s Take
Never short a dull market! Bitcoin’s consolidation will come to an end soon, and it likely ends with a big up candle.
Stay safe my friends!
Go to our Crypto Banter Discord here where Sheldon and Kyle give updates on the charts and trades from The Daily Candle newsletter!