

📈📉 Bulls and bears fighting for these crucial levels! Time to take profits on LINK?
📈📉 Bulls and bears fighting for these crucial levels! Time to take profits on LINK?

Bitget winner - 6062270365
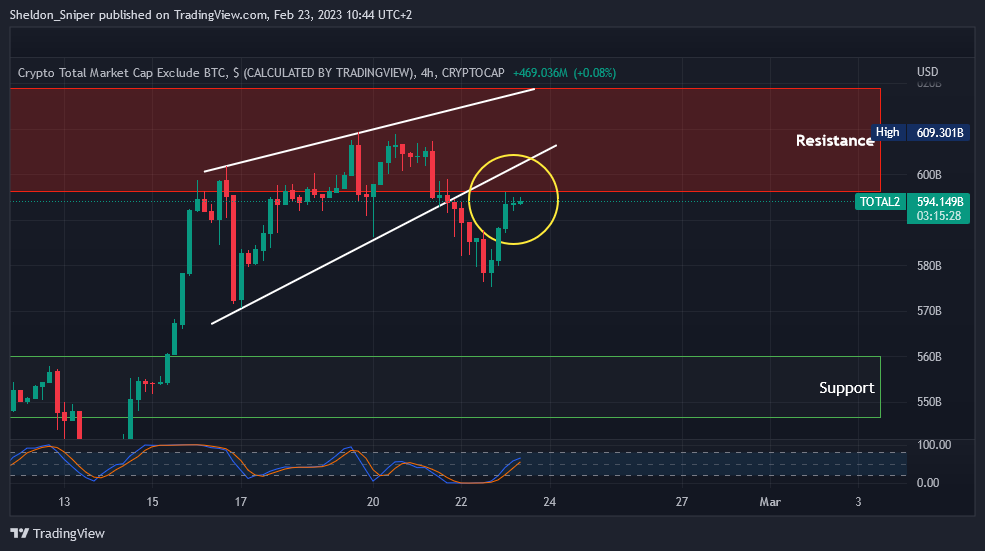
Chart #1 - TOTAL2 4-Hour Chart
Chartist: Sheldon
(For the chart screenshot, click here.)
Over the past week, the TOTAL2 has attempted to break the $605B resistance level on at least four occasions but has been rejected each time.
It had been in a rising wedge structure since the 17th of February, but yesterday we saw it break down and out of the structure to test the $575B level (support). It reversed from there and is once again testing $600B. It’s too early to tell whether this is a retest of yesterday’s break to the downside, but if the TOTAL2 drops from here, the next important area of support is around $560B.
A drop from here will not be good for the altcoins. But a break above the current resistance level could send the TOTAL2 to the next one, at $630B.
Check our Crypto Banter Discord here for updates!
Follow me on Twitter for urgent updates on my trading progress!
Claim your Bitget sign-up bonuses here (details below).
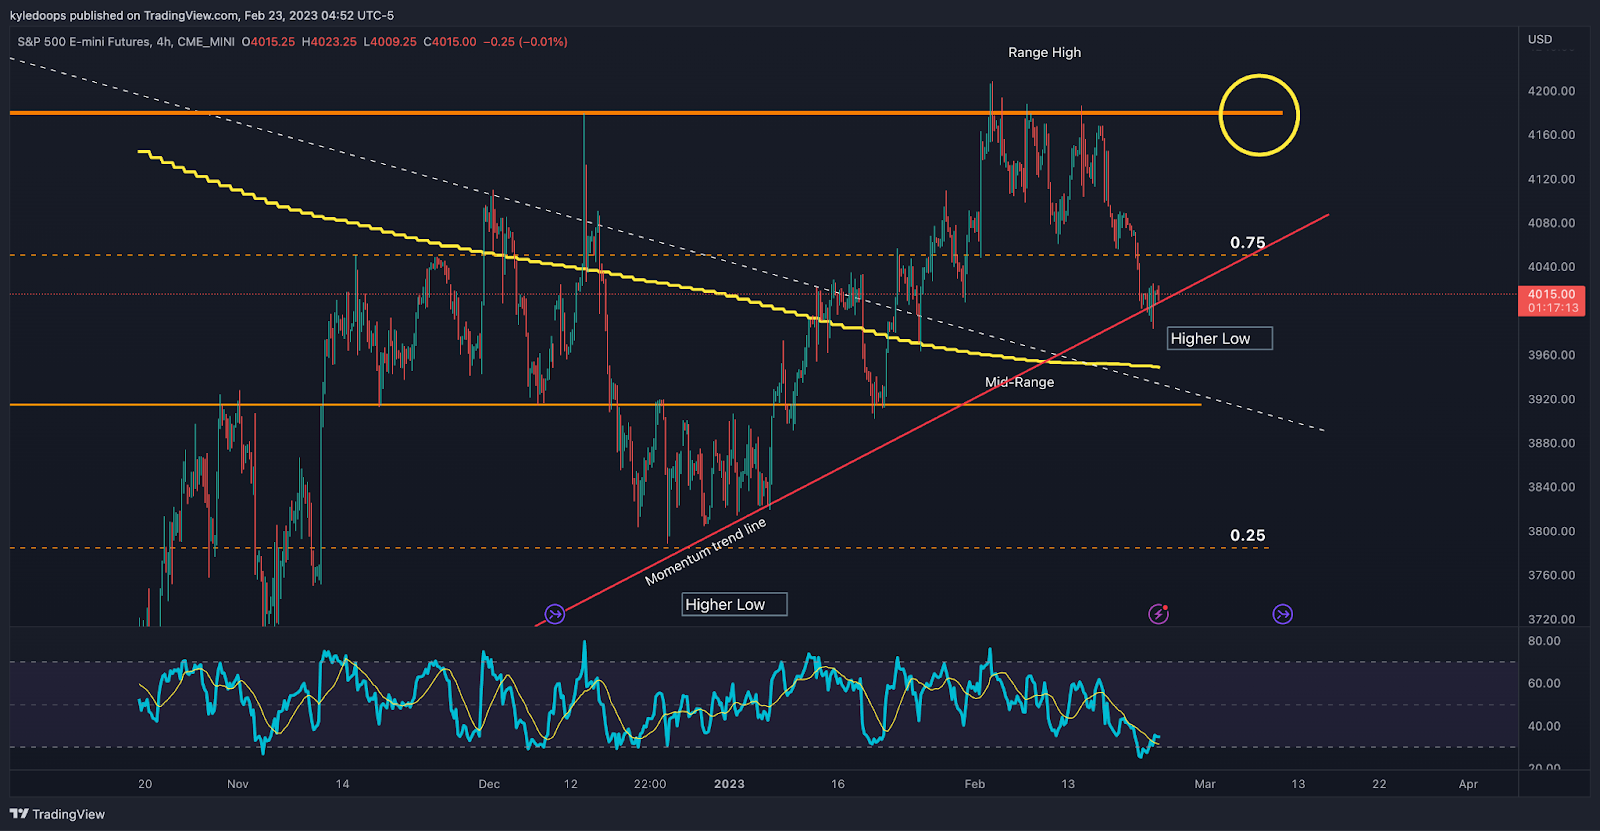
Chart #2 - S&P 500 4-Hour Chart
Chartist: Kyle
(For the chart screenshot, click here.)
The stock market is bouncing off of key support.
If it continues strong today and manages to reclaim its range’s 0.75 level - sitting at 4,050 - it would confirm a higher low. The expectation would be that crypto would also continue to rally as a result.
Furthermore, there are additional support levels below. The first is the 200-day moving average (yellow), and the second is the mid-range.
Check our Crypto Banter Discord here for updates!
Make sure to follow me on Twitter, where I will post updates on my trades as they unfold!
Claim your Bitget sign-up bonuses here (details below).
Sniper School
Sniper School kicks off a new cohort next week on Monday! What is Sniper School? Free 3-week trading course with Sheldon. You will learn how to trade like a pro in 3 short weeks and capitalize on the change in the markets.
There are only 3k seats and the waitlist is filling up fast! We still have some spots left for those that complete the entrance requirements of signing up for a fee exchange account and funding it. You’ll use it to trade live during the course.
The course includes weekly live workshops hosted by Sheldon, Mama Sniper, and special guests, plus daily live trading and market analysis sessions with our team of Sniper Mentors!
It’s not just a school. It really is the start of an incredible journey with our family of degens! Reserve your spot now by clicking here.
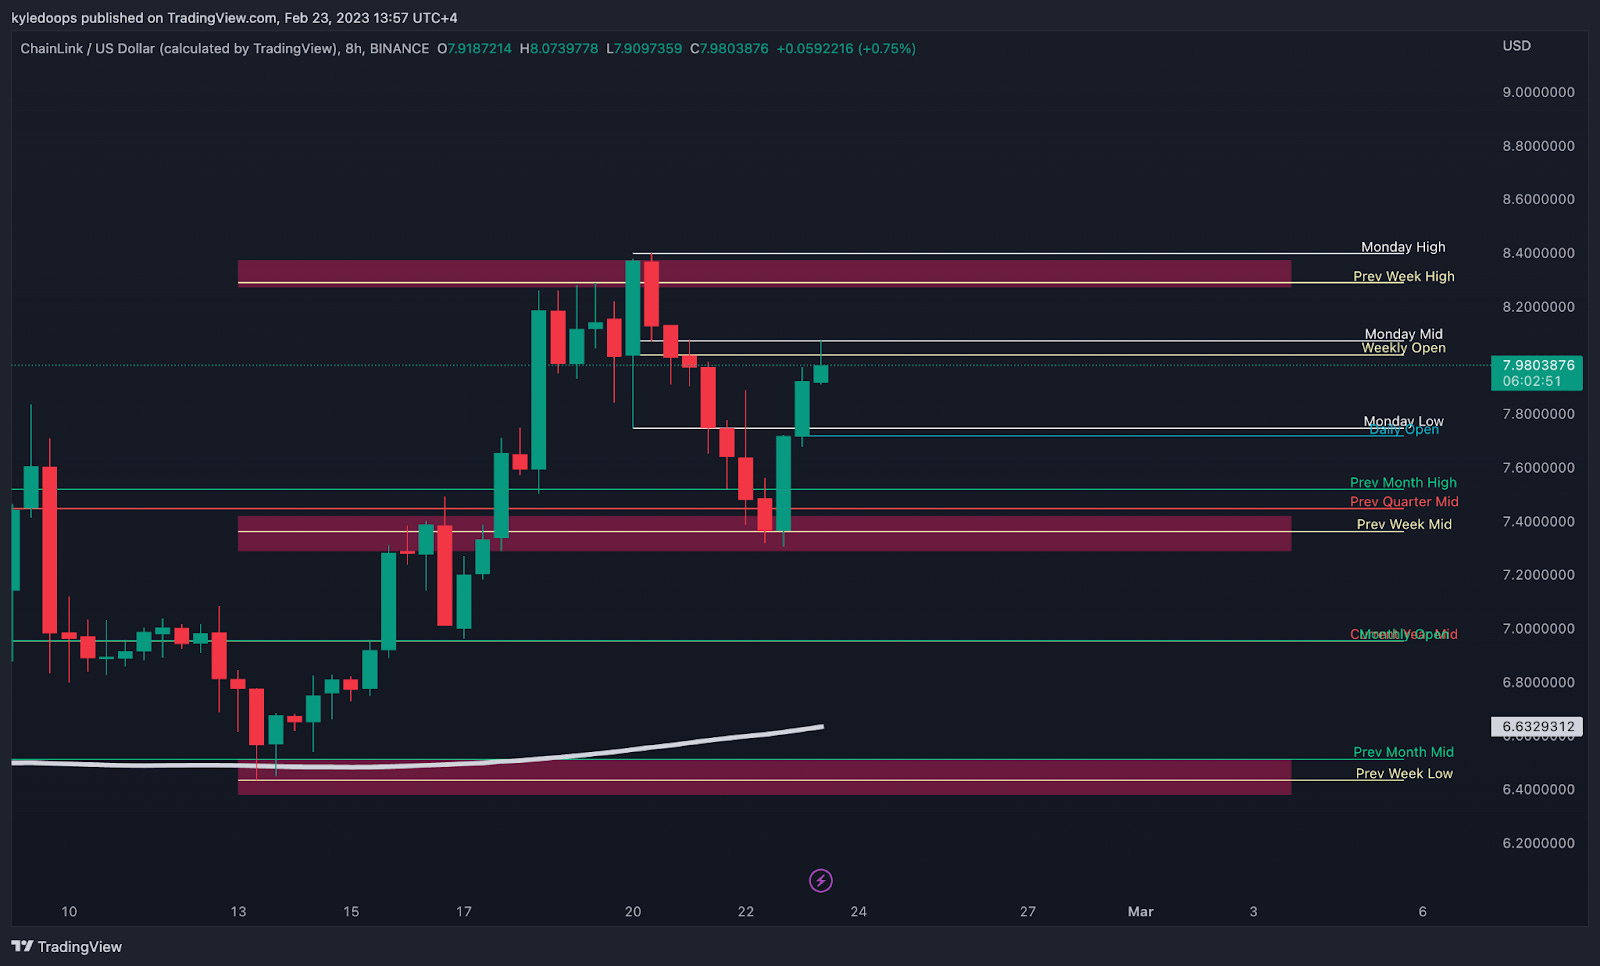
Chart #3 - Chainlink (LINKUSD) 8-Hour Chart
Chartist: Kyle
(For the chart screenshot, click here.)
Here's an update on yesterday's LINK trade.
LINK got its bounce from the mid-range level, so now we are on the lookout for a lower high. If it turns back down from the current level, it would be best to take profits.
If the bullish momentum continues across the broader crypto market, LINK could tag the range high at $8.40 and possibly even make a higher high.
Check our Crypto Banter Discord here for updates!
Make sure to follow me on Twitter, where I will post updates on my trades as they unfold!
Claim your Bitget sign-up bonuses here (details below).
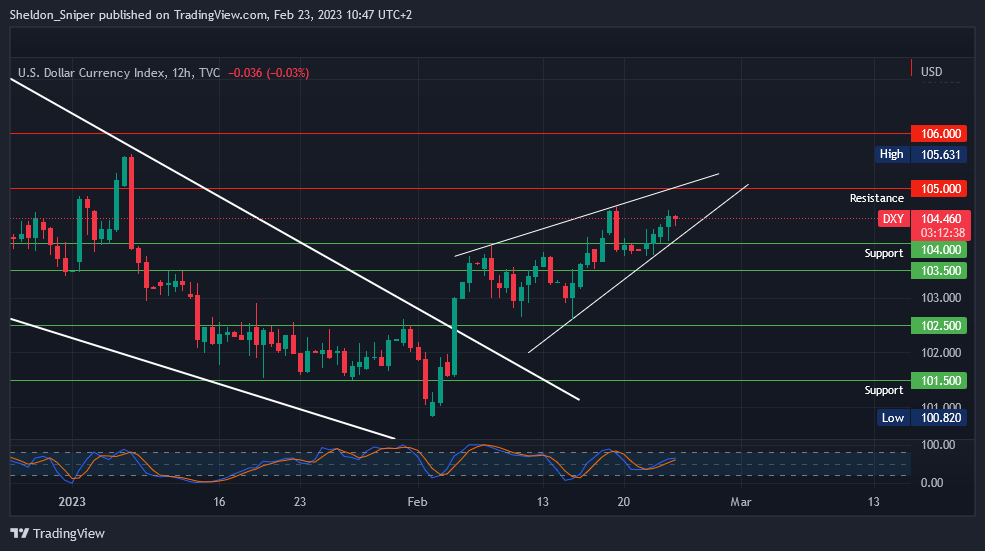
Chart #4 - DXY 12-Hour Chart
Chartist: Sheldon
(For the chart screenshot, click here.)
The DXY was in a downtrend from September till February, resulting in rallies for stocks and crypto. At the beginning of February, it found its current support low of 100.82, immediately reversed off there, and has been trending upward ever since.
Having broken out of the falling wedge structure it had been in for the past five months, this rapid movement to the upside has caused some uncertainty in the markets.
The DXY is currently testing the area of resistance between 104.50 - 105. A break above 105 could mean a test of the next resistance zone at 106 - 106.50.
If the DXY reverses and loses the 104 area of support, the next one is at 103.50, followed by 102.50.
Check our Crypto Banter Discord here for updates!
Follow me on Twitter to get all the updates on my personal trading progress!
Claim your Bitget sign-up bonuses here (details below).
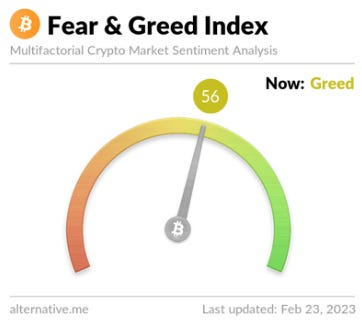
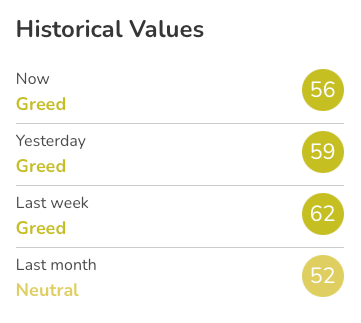
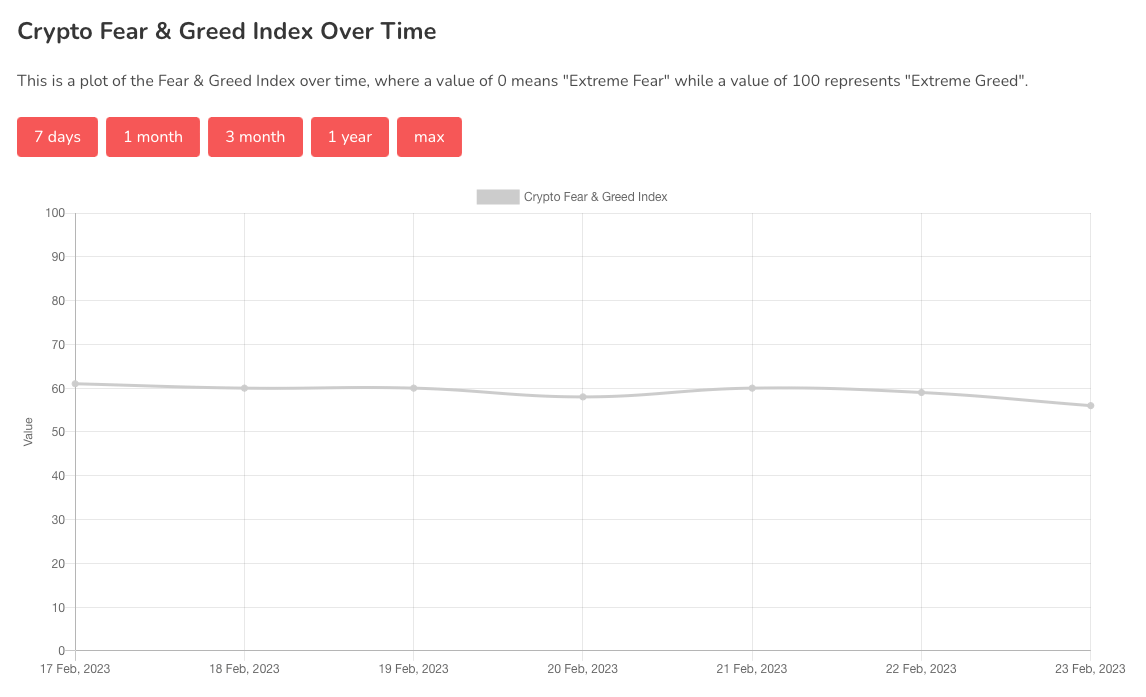
Chart #5 - Bitcoin Fear and Greed Index
The Bitcoin Fear and Greed Index is sitting at 56 today, indicating Greed.
The highest the index has been over the past seven days is 61, and the lowest is 56.
Overall Market Sentiment (Banter’s Take)
The market is likely to range for a couple of days. Both the bulls and the bears are fighting to win key levels. Only once the consolidation is over will we know the way the market wants to head.
But since the trend on the daily chart is up, it may be better to back the bulls.
Stay safe my friends!
Bybit winner - 7741586