

📈📉 Bulls have a chance to reverse the market! This is our next BTC trade!
📈📉 Bulls have a chance to reverse the market! This is our next BTC trade!

Chart #1 - Polygon (MATICUSDT) 1-Day Chart
Chartist: Sheldon

(For the chart screenshot, click here.)
MATIC is one of the alts that has been consolidating over the last two weeks, and the price could be setting itself up to move higher and test the next area of resistance.
It is currently trading near $1 (support), so a move up from here could mean visiting $1.20 - $1.30 (resistance) - an area that got tested in November.
If the current level of support is lost, it will possibly take the price back down to $0.80, a level that has been holding since August.
Check our Crypto Banter Discord here for updates!
Follow me on Twitter for urgent updates on my trading progress!
Claim your Bitget sign-up bonuses here (details below).
Winning Bitget UID - 1067701274
Chart #2 - Bitcoin (BTCUSD) 15-Minute Chart
Chartist: Kyle
(For the chart screenshot, click here.)
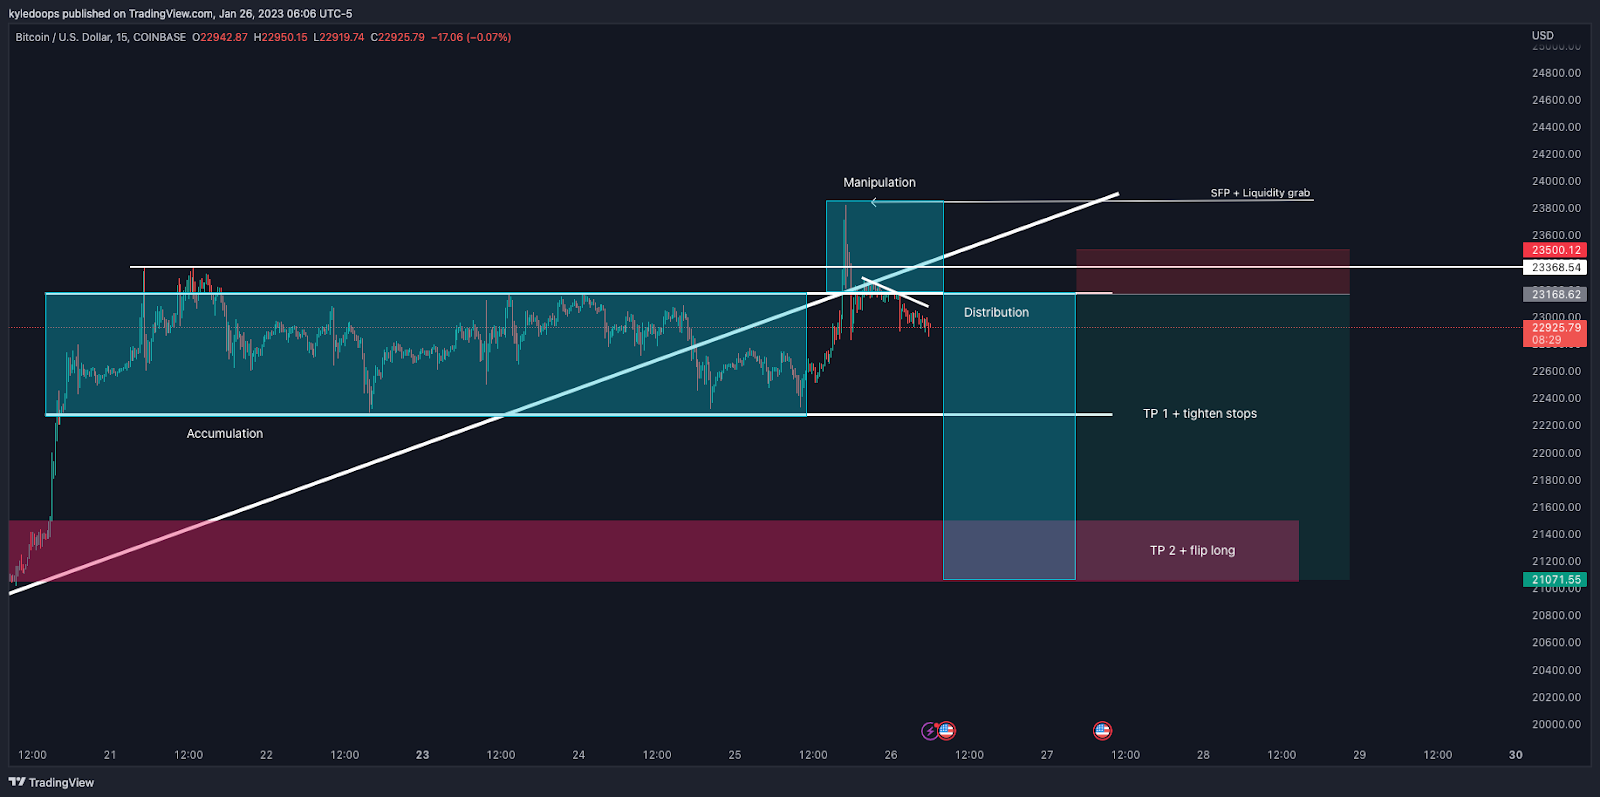
Here is a trade set-up based on the "Power of Three" strategy. Let's examine.
First, bitcoin consolidated. That is referred to as the accumulation phase. Next, we saw a big spike up as a swing failure pattern and liquidity grab, also known as the manipulation phase. Following on, the price broke back down into the range.
Now, a retest of the range-high opens up the opportunity for a short trade, with the distribution phase playing out down to the bottom of the range. That's where I would take my first profits and tighten my stop loss before aiming for the TP2 zone ($21,000 - $21,500), where I would immediately flip long.
Check our Crypto Banter Discord here for updates!
Make sure to follow me on Twitter, where I will post updates on my trades as they unfold!
Claim your Bitget sign-up bonuses here (details below).
Chart #3 - S&P 500 and VIX 3-Day Chart
Chartist: Kyle
(For the chart screenshot, click here.)
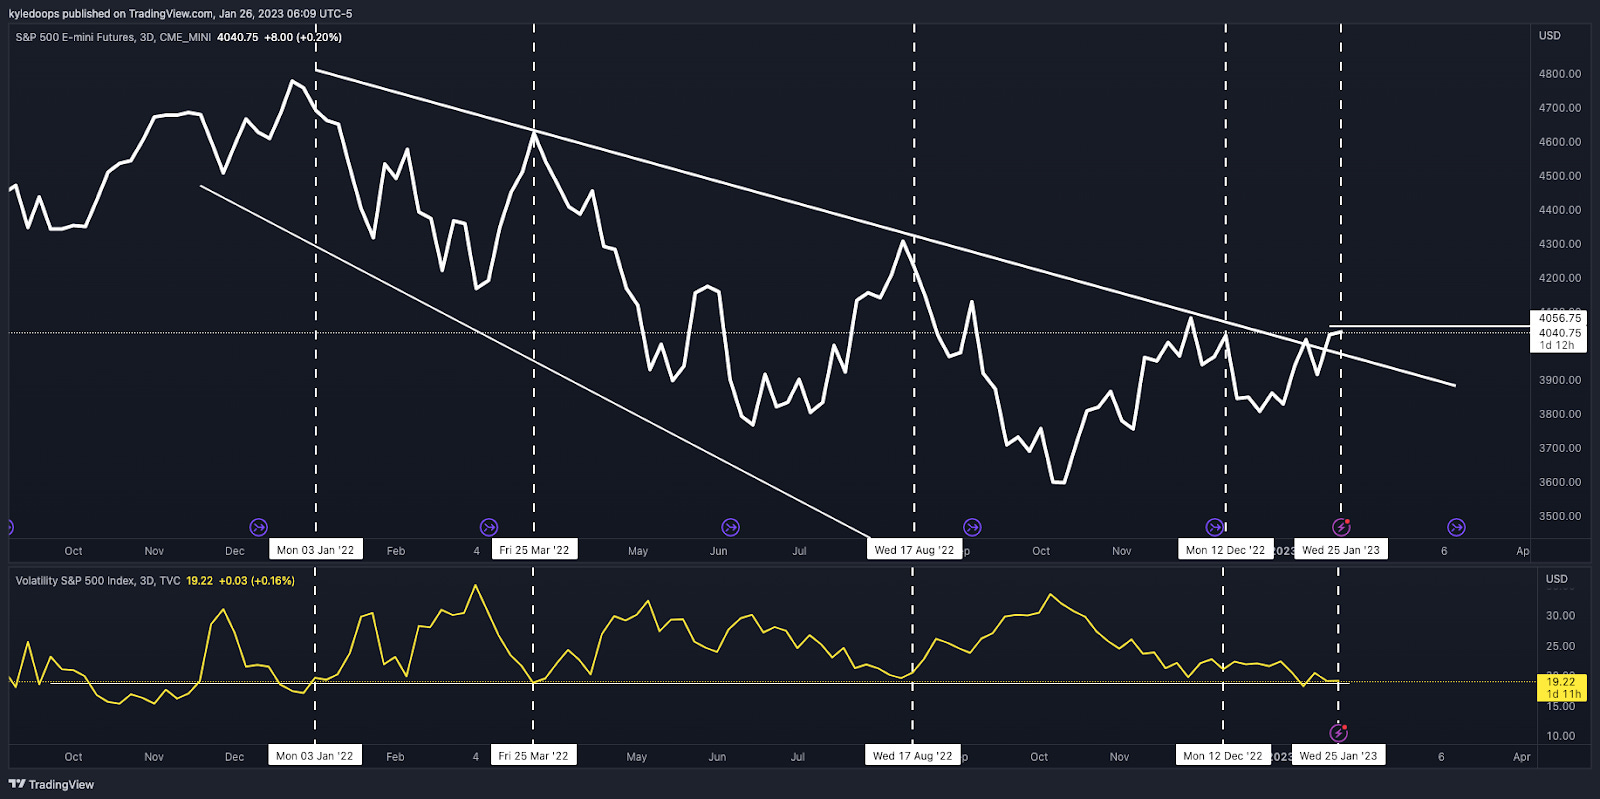
Here's the S&P 500 on the 3-Day chart with the VIX underneath.
The S&P 500 is at a critical level where bulls have a chance to reverse the market, but with the VIX squeezing into the 18 - 20 area, it's still a close call. That is because all major tops on the stock market (in the past year) occurred when the VIX was consolidating at its lows for the same amount of time as now.
If you look at the RSI trend line for the stock market on the daily chart, there is a chance the area breaks through to the upside, and bulls take some control.
However, if the VIX spikes up aggressively while the stock market turns back down, there will be a lot of momentum that could seriously kick prices back down.
Check our Crypto Banter Discord here for updates!
Make sure to follow me on Twitter, where I will post updates on my trades as they unfold!
Claim your Bitget sign-up bonuses here (details below).
Chart #4 - GALA (GALAUSDT) 1-Day Chart
Chartist: Sheldon
(For the chart screenshot, click here.)
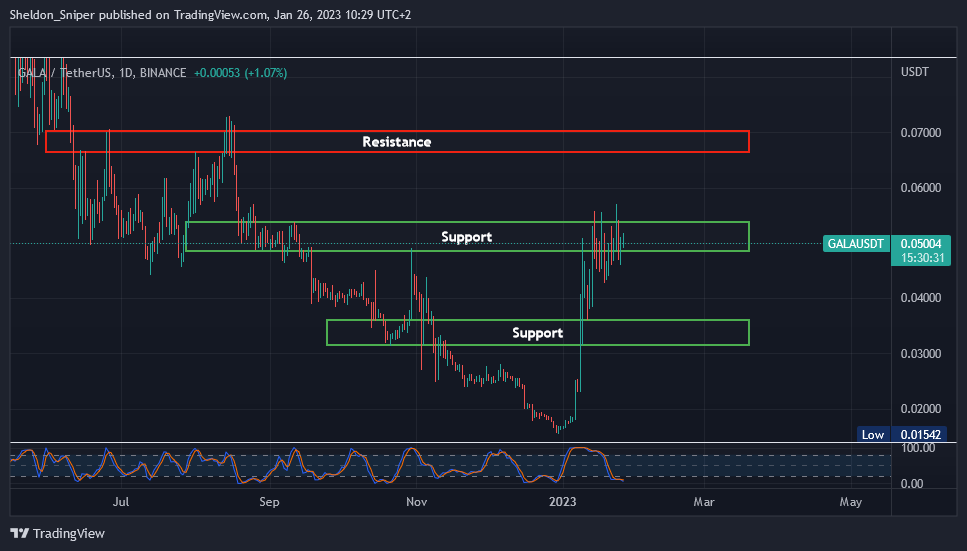
GALA has been one of the star performers this month, moving from below $0.02 up to $0.05 (support), where it has been consolidating.
There is a chance GALA wants to move higher and test resistance at roughly $0.07. But if the current $0.05 support level is lost, the next support is at $0.035 - $0.04.
The gaming category has done very well in January, and I think there is room for a lot more upside over the next few months.
Check our Crypto Banter Discord here for updates!
Follow me on Twitter to get all the updates on my personal trading progress!
Claim your Bitget sign-up bonuses here (details below).
Winning Bybit UID - 26912567
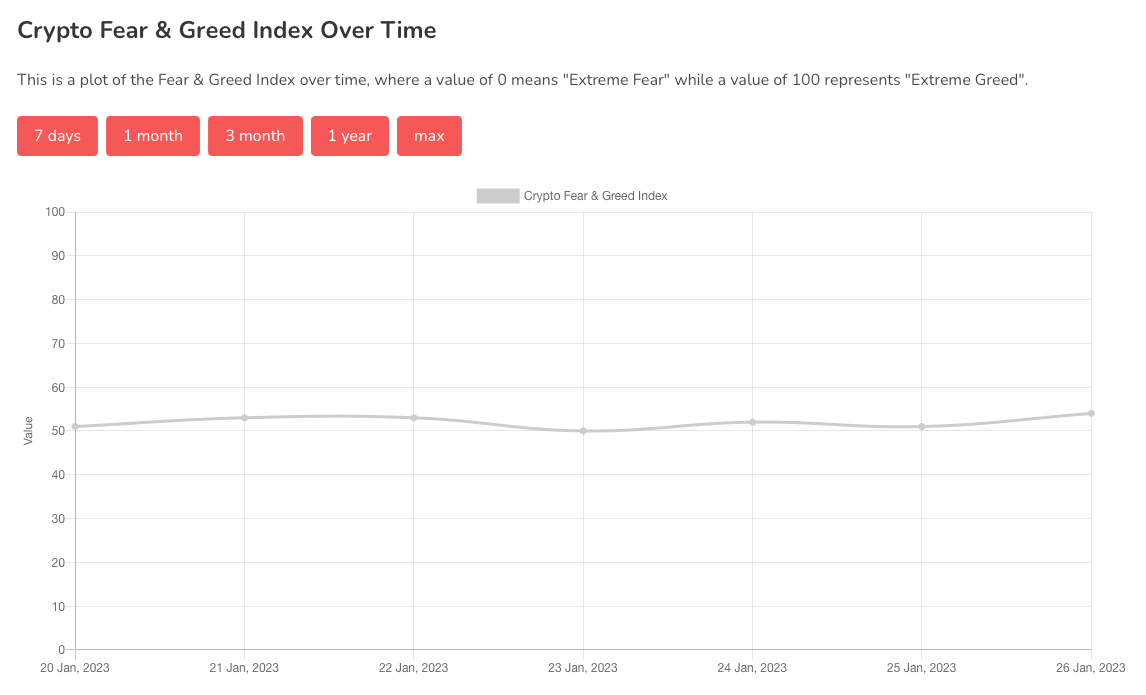
Chart #5 - Bitcoin Fear and Greed Index
The Bitcoin Fear and Greed Index is sitting at 54 today, Neutral.
The highest the index has been over the past seven days is 54, and the lowest is 50.
Overall Market Sentiment (Banter’s Take)
The prices have been pumping. But, the market may have one more small pullback before BTC’s next leg up to $25,000. We await patiently for answers from the stock market.
Stay safe my friends!