

📈📉 Can BTC Survive Today's CPI Print?
📈📉 Can BTC Survive Today's CPI Print?
PLUS: AVAX at Critical Support! Time to BUY?
Overview
Chart #1 - Bitcoin (BTCUSDT) Daily
Chart #2 - S&P 500 Futures (ES1!) Daily
Chart #3 - 20+ Year Treasury Bond Monthly
Chart #4 - Avalanche (AVAXUSDT) Daily
Chart #5 - Fear and Greed Index

Chart #1 - Bitcoin (BTCUSDT) Daily
Chartist: Sheldon
(For the chart screenshot, click here.)
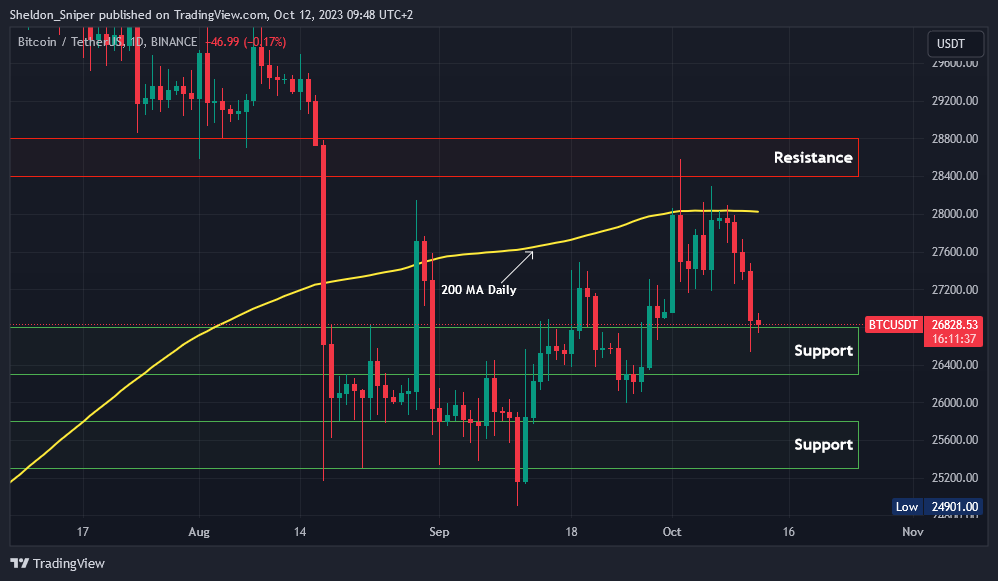
Yesterday, BTC declined from approximately $27,500 to $26,500, settling into the $26,300 - $26,800 support zone. This support seems to be holding for now. Crucially, the $26,600 mid-range support must remain intact.
If sustained, we might observe a renewed upward movement challenging subsequent resistance levels. Today's release of the US CPI data could sway the markets and potentially set the short-term trajectory for the coming weeks.
BTC is currently at $26,800. If the $26,600 support holds and the trend pivots upwards, the next resistance stands at $27,200. Beyond that, the significant resistance is the daily 200 Moving Average at $28,000, which has consistently resisted price advances for the past two months.
The subsequent resistance zone is between $28,400 and $28,800, coinciding with the region that provided support from mid-July to mid-August. If the price breaks below the $26,300 support, the following support range is from $25,300 to $25,800 - the same zone that served as support from mid-August to mid-September.
Sign-up and trade on Bybit today.
Exclusive $30,000 deposit rewards and bonuses up for grabs!
Chart #2 - S&P 500 Futures (ES1!) Daily
Chartist: Kyle

(For the chart screenshot, click here.)
The S&P 500 daily chart is consistently bouncing from the 200 MA support.
It's projected to encounter its next resistance at 4,500, possibly by this week's end.
Should it surpass that mark, I'd anticipate sellers to re-enter around the grey box at 4,600, potentially setting a new range high before retracing to establish a range low.
Claim your Bitget sign-up bonuses here (details below).
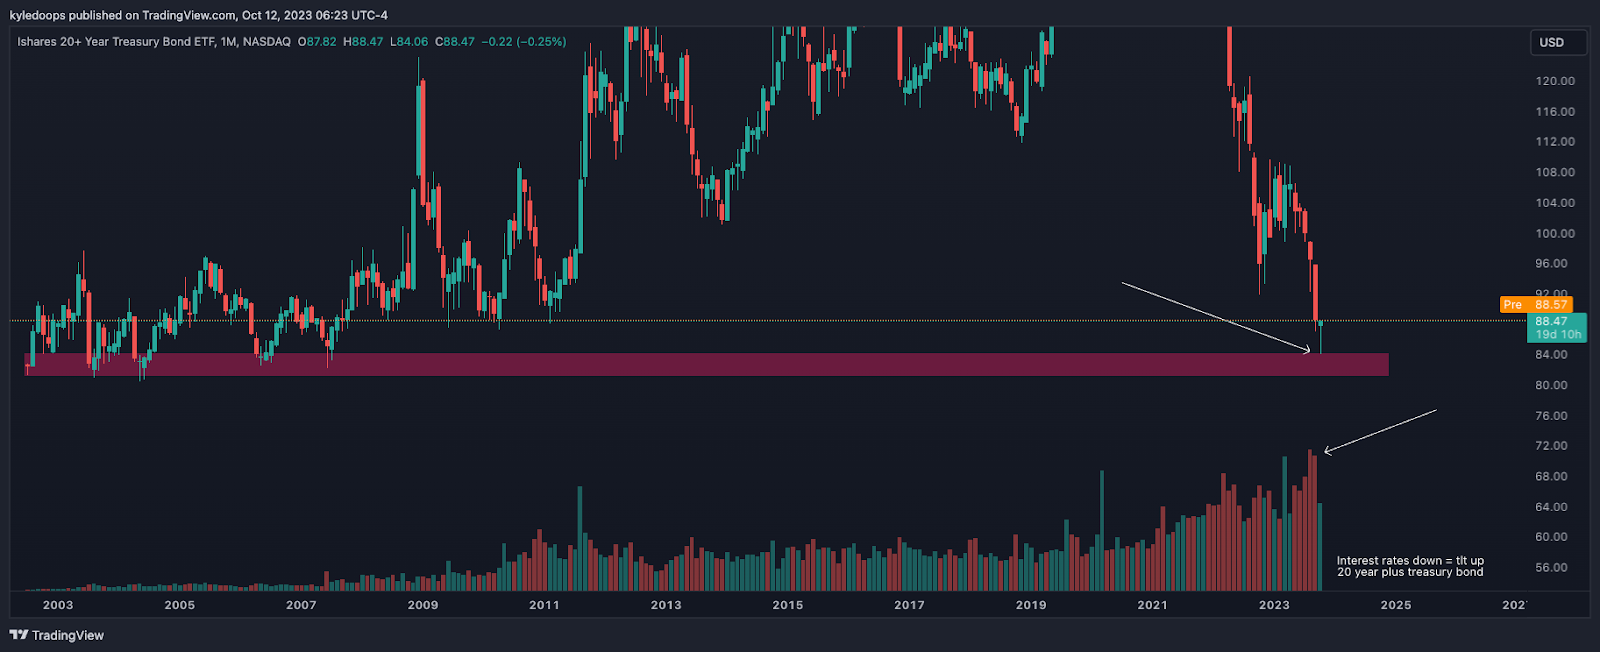
Chart #3 - 20+ Year Treasury Bond Monthly
Chartist: Kyle
(For the chart screenshot, click here.)
Numerous attempts to buy into this have been unsuccessful as its price keeps plummeting.
We pinpointed the demand area where potential buyers might attempt to catch the drop. Entry occurred precisely at that designated level, accompanied by a climax in selling volume. This means buyers might now significantly drive the price upwards.
Typically, when TLT rises, interest rates tend to fall, an observation that gains significance in light of today's CPI release.
This might hint at the CPI turning out more favorable than anticipated.
Claim your Bitget sign-up bonuses here (details below).
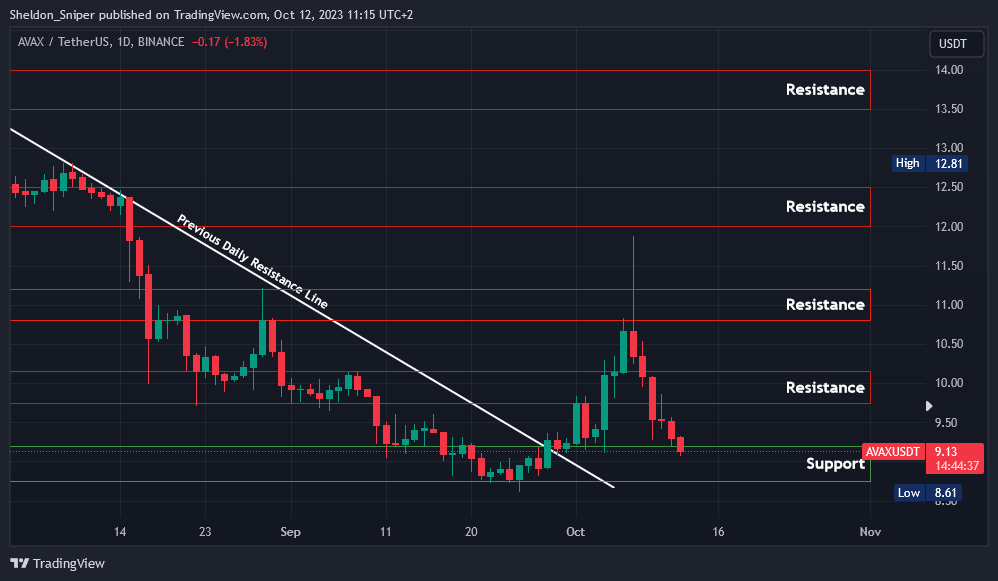
Chart #4 - Avalanche (AVAXUSDT) Daily
Chartist: Sheldon
(For the chart screenshot, click here.)
Over the past week, the market has experienced a gradual decline. Several coins have reached critical support levels, with AVAX being one of them.
AVAX performed well at the end of the previous month, surging over 40% within a few weeks. I believe AVAX might have more to offer in the short term, especially if BTC's price stabilizes or rises.
Currently, AVAX is hovering around the $8.80 - $9.20 support zone. If the price finds stability here, we might see a trend reversal, with the price aiming to test $9.75 and $10.25.
Claim your Bitget sign-up bonuses here (details below).
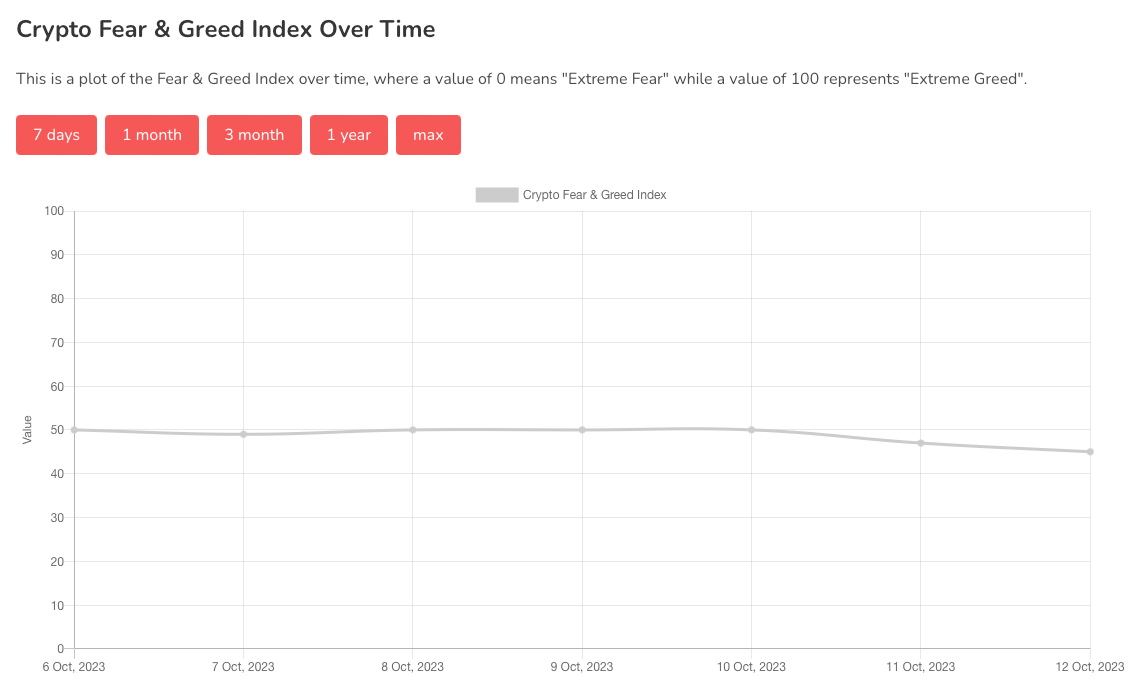
Chart #5 - Fear and Greed Index
The Fear and Greed Index is sitting at 45 today, indicating Fear.
The highest the index has been over the past seven days is 50, and the lowest is 45.
Banter’s Take
Post-inflation print, traders should remain vigilant. While Bitcoin currently faces downside risk, it has the potential to set a higher low, suggesting a possibility for trend continuation.
Stay safe my friends!
Go to our Crypto Banter Discord here where Sheldon and Kyle give updates on the charts and trades from The Daily Candle newsletter!