

📈📉 Can ETH Reach $2,900 Next?
📈📉 Can ETH Reach $2,900 Next?
PLUS: We Go Long SOL at THIS Level!
Overview
Chart #1 - Solana (SOLUSDT) 12-Hour
Chart #2 - Akash Network (AKTUSDT) 4-Hour
Chart #3 - Ethereum (ETHUSD) Daily
Chart #4 - Fantom (FTMUSDT) Daily
Chart #5 - Fear and Greed Index
Chart #1 - Solana (SOLUSDT) 12-Hour
Chartist: Sheldon
(For the chart screenshot, click here.)
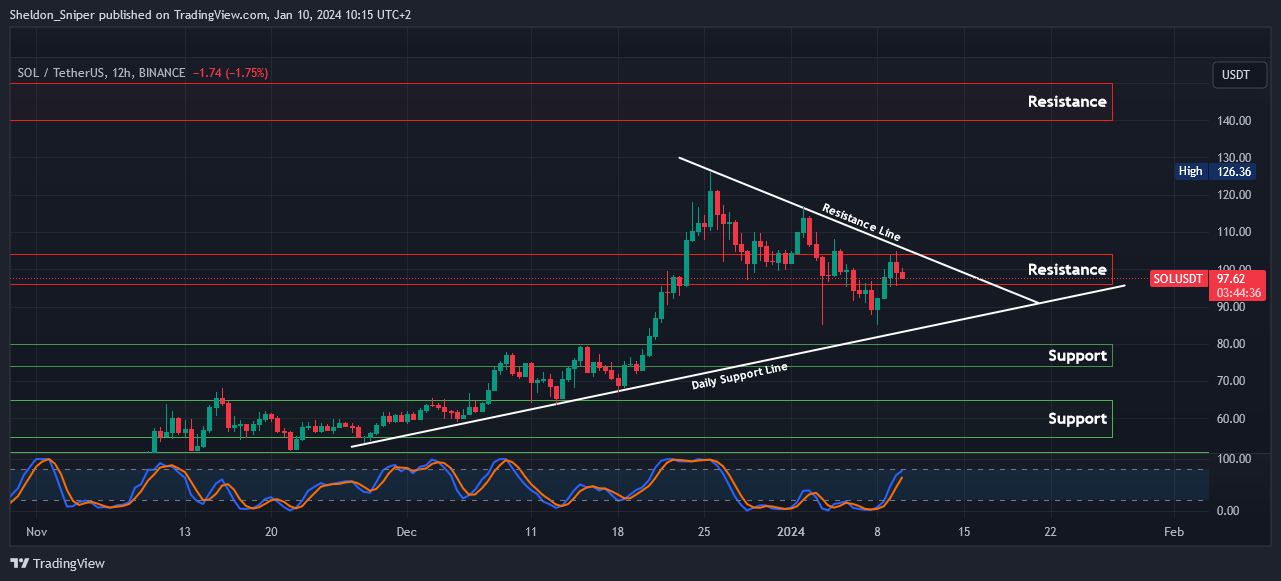
Over the last two weeks, SOL has been undergoing a correction and could retrace further to test support at $85, or even the next area of support at $75 - $80.
I’ll be looking for a long trade opportunity in that area, provided the price tests it and holds it.
But, if it breaks through the $105 - $110 level of resistance on a higher time frame, the next one is up at $140 - $150.
Sign-up and trade on Bybit today.
Exclusive $30,000 deposit rewards and bonuses up for grabs!
Chart #2 - Akash Network (AKTUSDT) 4-Hour
Chartist: Kyle
(For the chart screenshot, click here.)
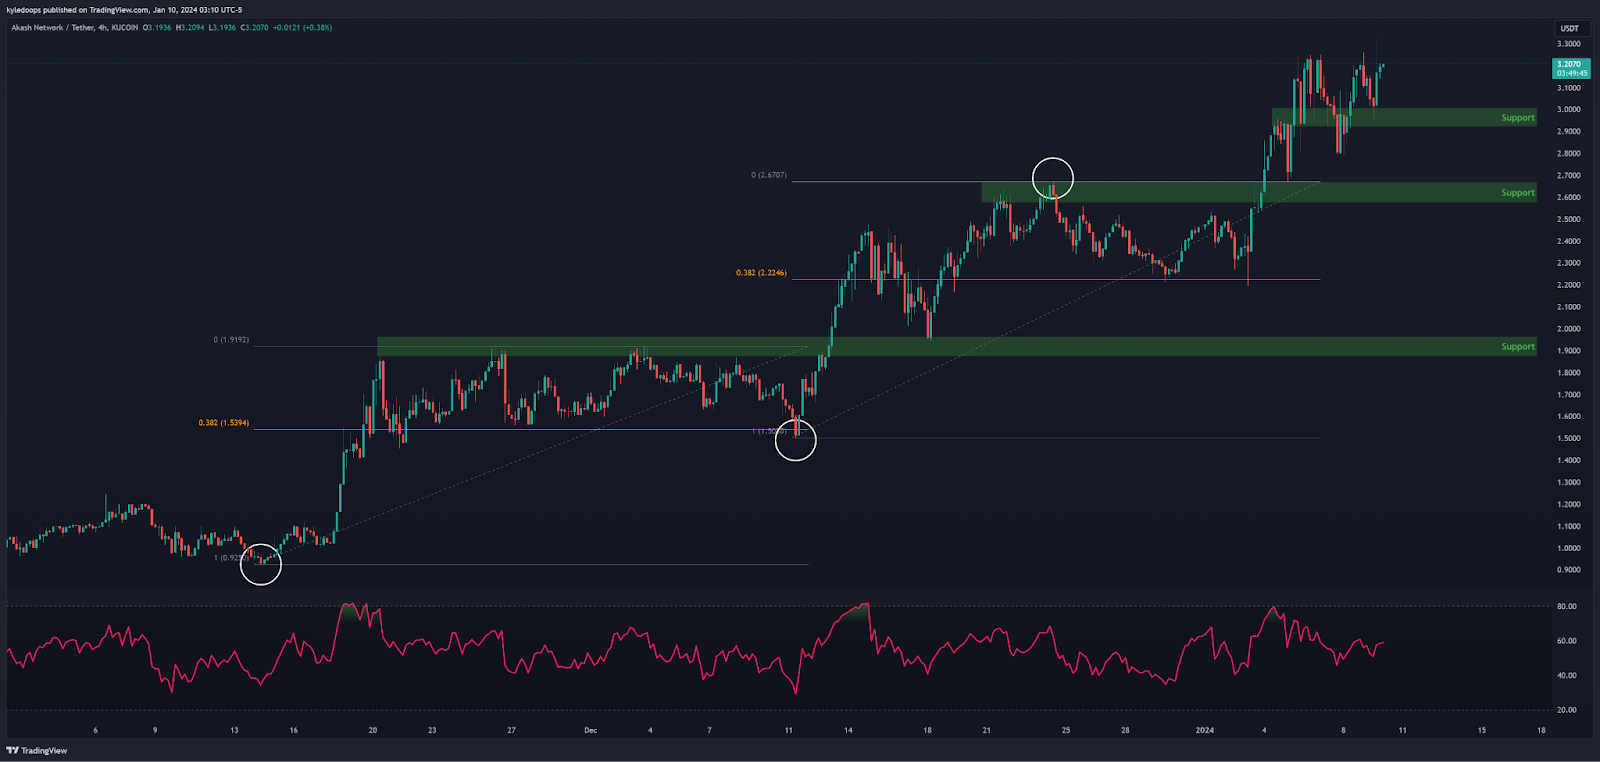
Despite the fear instilled in the market by yesterday's price action, AKT is holding strong and pushing to new All-Time Highs.
All previous retracements have not fallen below the 0.382 level on the Fibonacci, indicating strength and momentum. The current support level is at $3.00, and its market cap, at $715 million, has been consistently rising since last October (and is currently outperforming Bitcoin).
Breaking above $3.25, we will see new ATHs, while the RSI rising from the 50 area means that there is still room for further upward movement.
Claim your Bitget sign-up bonuses here (details below).

Outsmart 99% Of The Market!
Get full access into our Discord And Telegram group, where you'll find all of our premium content!
👉 Trade Signals!
👉 Trade Set-Ups!
👉 Trading Challenges!
👉 Education!
👉 SO MUCH MORE!
Chart #3 - Ethereum (ETHUSD) Daily
Chartist: Kyle
(For the chart screenshot, click here.)
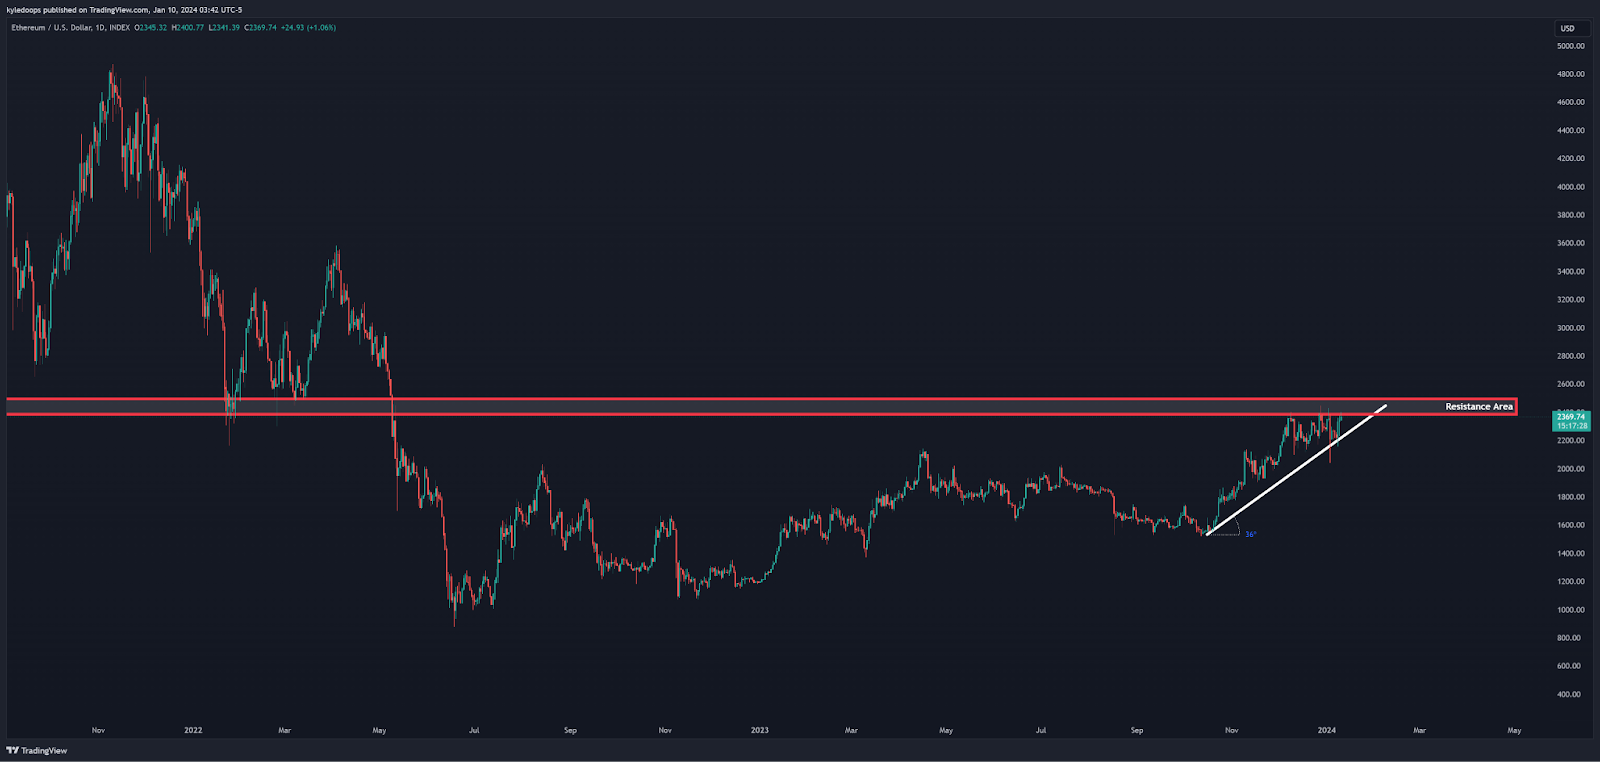
Ethereum is once again tapping the resistance level of $2,400 while building a healthy and strong uptrend at an angle of approximately 45 degrees.
If it manages to break above, the next expected level of resistance is at $2,900. On the other hand, if it loses the $2,200 bottom range, then the next support level is in the $1,500 area.
For those looking to trade on the upside, it's crucial to ensure that ETH not only breaks but also holds above the $2,400 level.
Claim your Bitget sign-up bonuses here (details below).
Chart #4 - Fantom (FTMUSDT) Daily
Chartist: Sheldon
(For the chart screenshot, click here.)
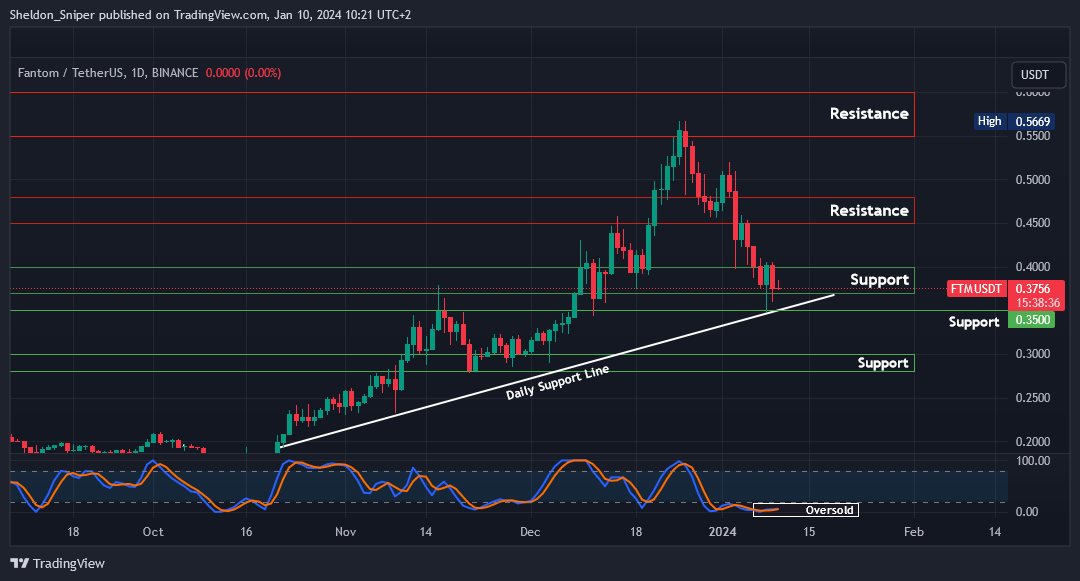
FTM, like most alts, has retraced over the last two weeks, dropping from $0.55 to $0.3750.
But there is a very strong area of support between $0.35 - $0.40.
The price is oversold and if it can consolidate in this support area and the market remains bullish, I would expect it to test $0.45 - $0.475.
Claim your Bitget sign-up bonuses here (details below).
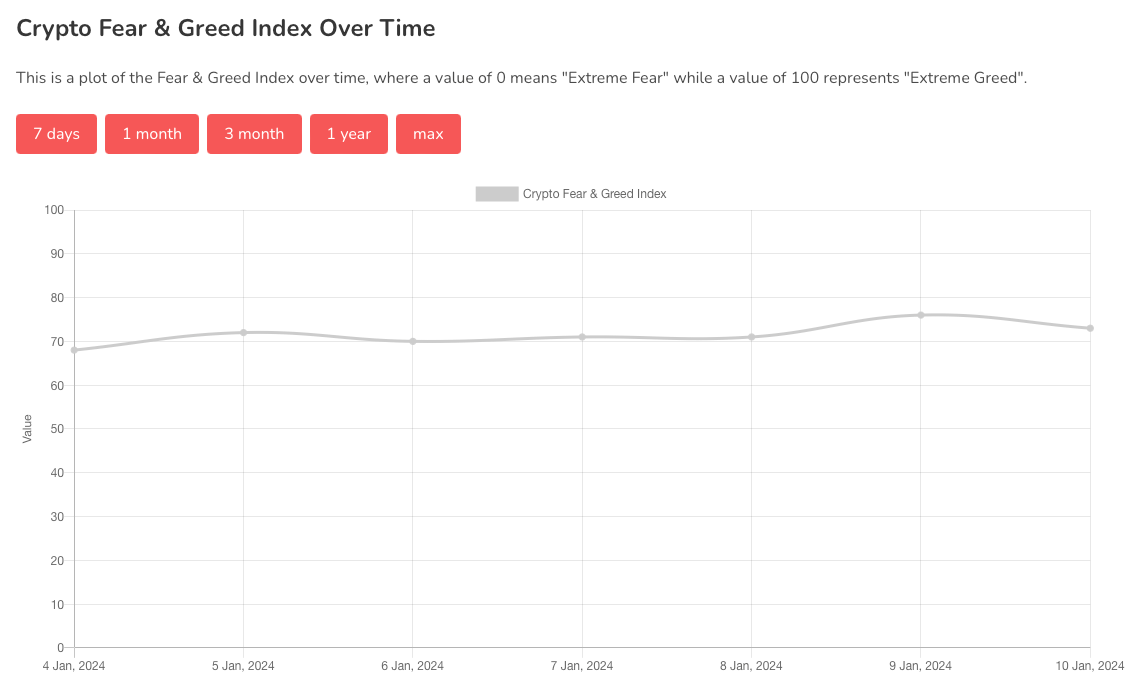
Chart #5 - Fear and Greed Index
The Fear and Greed Index is sitting at 73 today, indicating Greed.
The highest the index has been over the past seven days is 76, and the lowest is 68.
Banter’s Take
Yesterday's price action is likely to instill fear in the markets today, leading to an expected drop in Bitcoin Dominance. Pay close attention to Bitcoin's price, especially if it falls under $44,500 and enters a range; wait for it to settle before planning your next trade.
Stay safe my friends!
Go to our Crypto Banter Discord here where Sheldon and Kyle give updates on the charts and trades from The Daily Candle newsletter!