
📈📉 Can THIS 1100% Gain REPEAT? + BTC Short Trade Setup!
📈📉 Can THIS 1100% Gain REPEAT? + BTC Short Trade Setup!
PLUS Where will Apple Stock Go Next?
Overview
Chart #1 - Nakamoto Games (NAKAUSDT) Daily
Chart #2 - Bitcoin (BTCUSD) Hourly
Chart #3 - Apple (AAPL) Weekly
Chart #4 - Near (NEARUSDT) Daily
Chart #5 - Fear and Greed Index

Chart #1 - Nakamoto Games (NAKAUSDT) Daily Chart
Chartist: Sheldon

(For the chart screenshot, click here.)
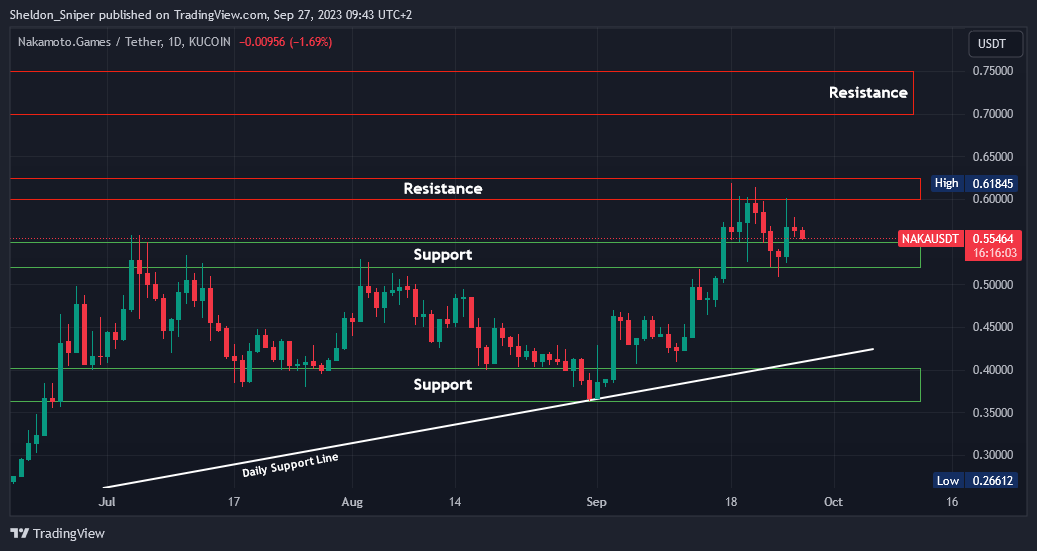
In 2023, NAKA's price soared by over 1,100%, significantly outpacing the broader crypto market.
I believe there might be further upside potential shortly. The current price is $0.55, consolidating between the $0.52 and $0.55 support range. If it maintains this support, we might see a rise to challenge the $0.60 - $0.625 resistance or even the subsequent $0.70 - $0.75 resistance.
Should NAKA drop below the $0.52 - $0.55 support, the next support is the $0.37 - $0.40 range, aligning with the ascending daily support line traced from the year's start.
Sign-up and trade on Bybit today.
Exclusive $30,000 deposit rewards and bonuses up for grabs!
Chart #2 - Bitcoin (BTCUSD) Hourly Chart
Chartist: Kyle
(For the chart screenshot, click here.)
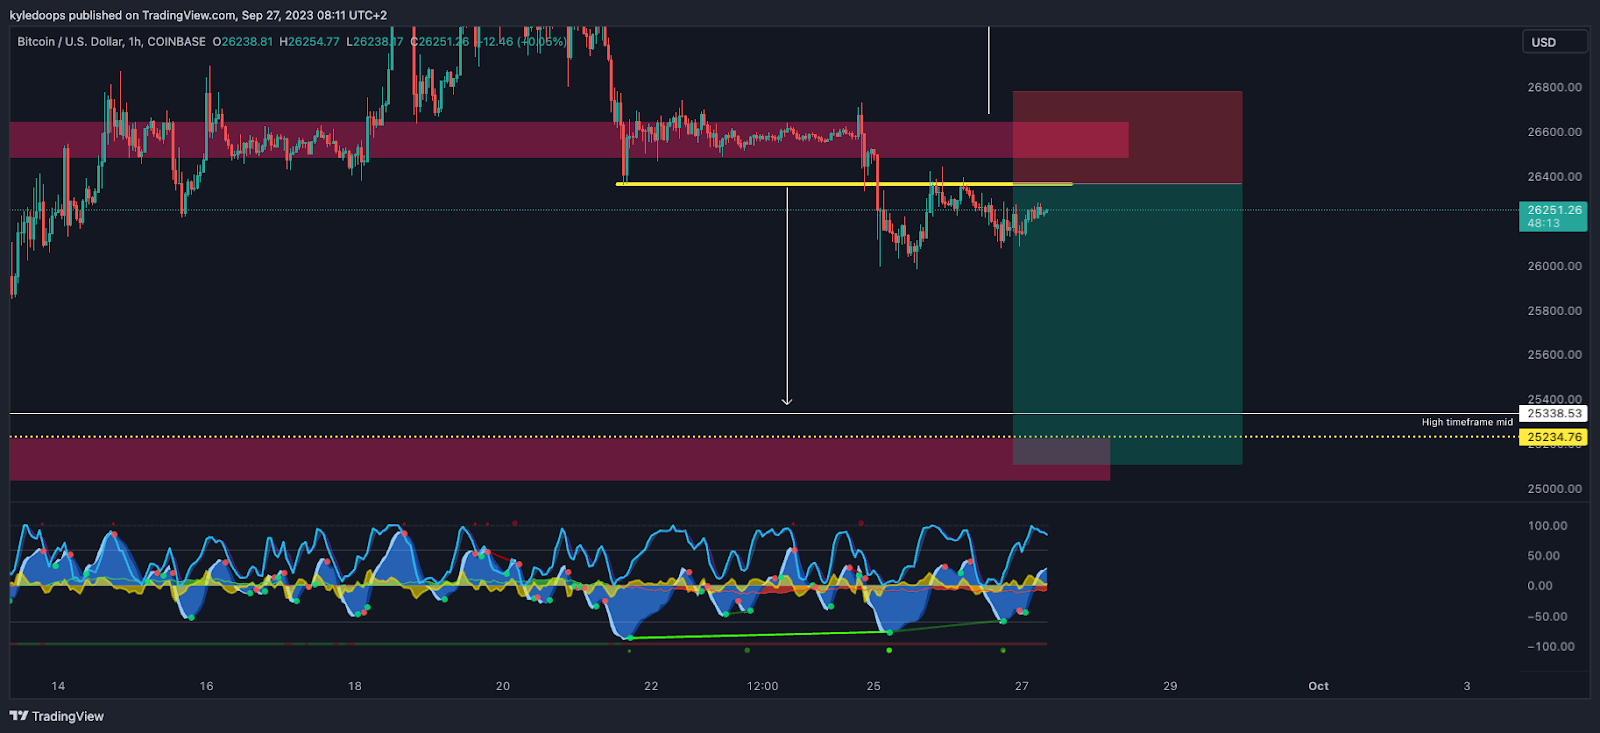
Bitcoin is losing its mid-range level and working its way back towards the bottom of the range.
There is a medium probability trade setup here with a 3:1 risk to reward ratio. I would be looking to scale into a short trade in this region; I would have 5 - 6 sell orders staggered between the entry and final stop level.
Take profit would be at the $25,200 range low support.
Claim your Bitget sign-up bonuses here.
Chart #3 - Apple (AAPL) Weekly Chart
Chartist: Kyle
(For the chart screenshot, click here.)
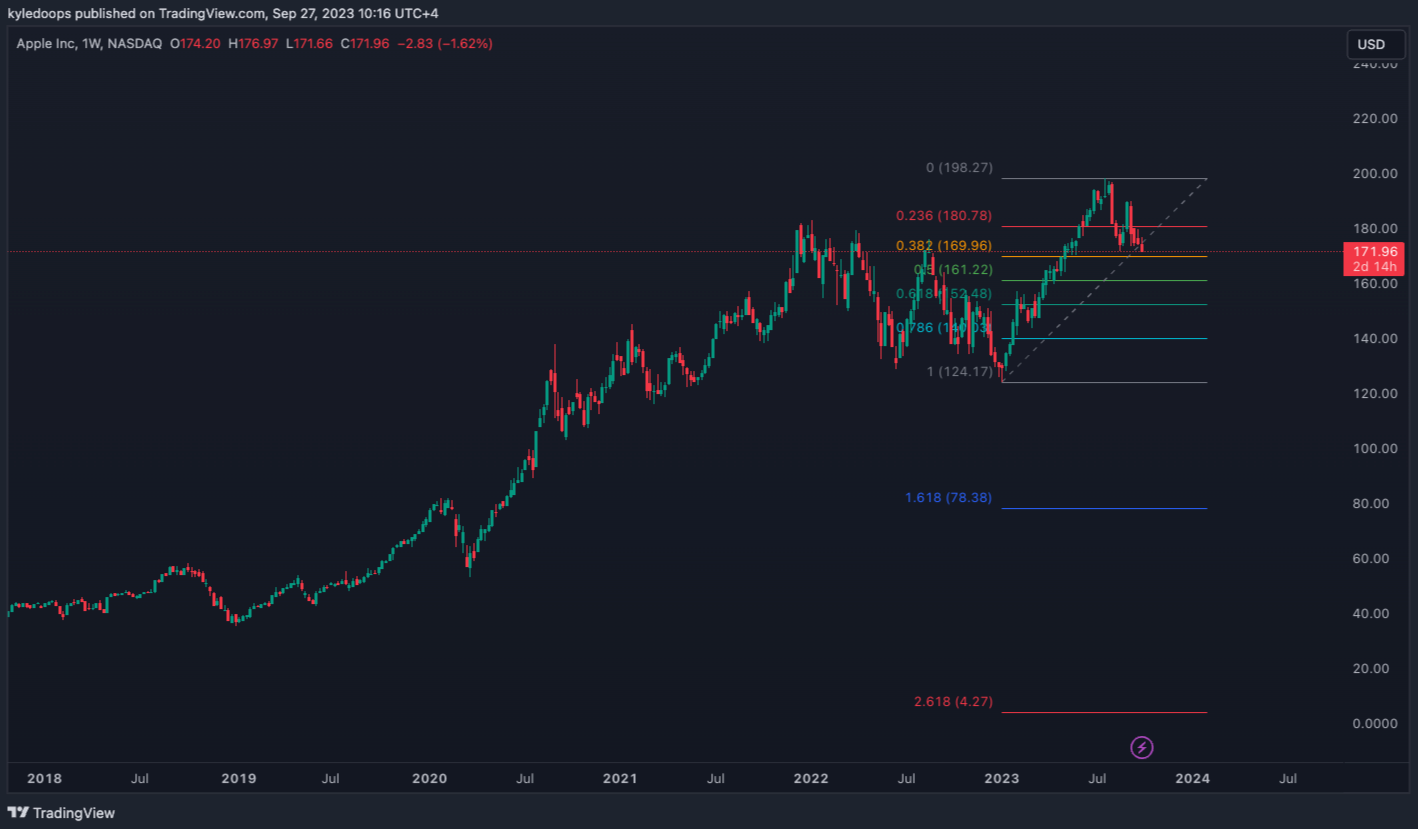
Many have fears that the top seven stocks in the S&P 500 are holding up the entire stock market, and if those stocks collapse, there will be a cataclysmic crash of all markets.
Charting one of these top stocks, you can see AAPL has created higher highs and higher lows and is currently going through a correction within an uptrend. Therefore, as it currently stands, it's a "buy the dip" scenario. We have the 0.382 as a potential support level, followed by the 0.5.
So, AAPL could find support between $161 and $169.
Claim your Bitget sign-up bonuses here.
Chart #4 - Near (NEARUSDT) Daily Chart
Chartist: Sheldon
(For the chart screenshot, click here.)
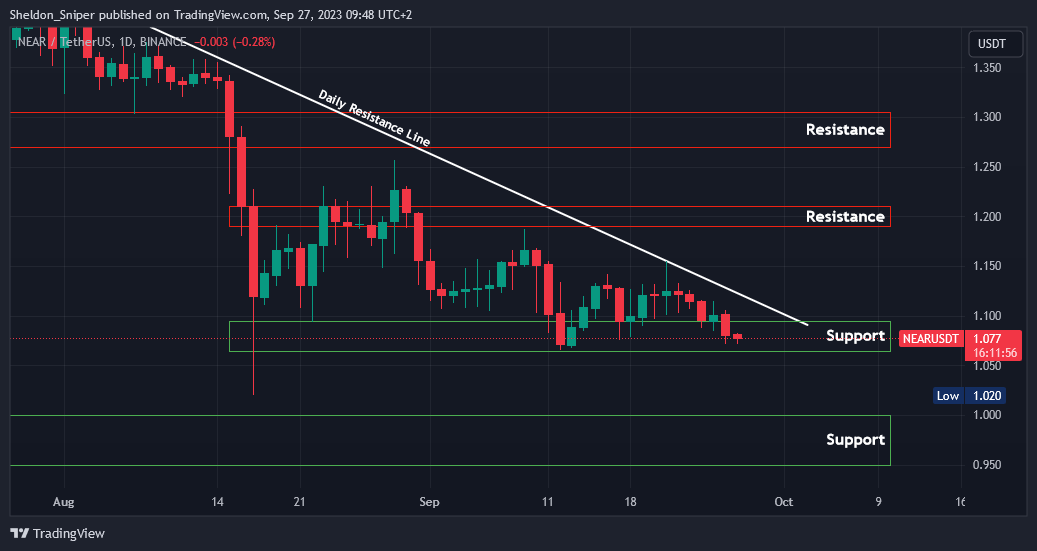
In the past month, NEAR's price has consolidated between the $1.07 - $1.10 support range and the $1.18 - $1.22 resistance range.
If the support remains intact, we could see the price attempt to breach the descending resistance line, from mid-July, at approximately $1.12. Should this resistance be breached, the $1.18 - $1.22 zone may be tested again.
However, if the price drops below the $1.07 - $1.10 support, the next significant support level is the $0.95 - $1.00 range.
Claim your Bitget sign-up bonuses here (details below).
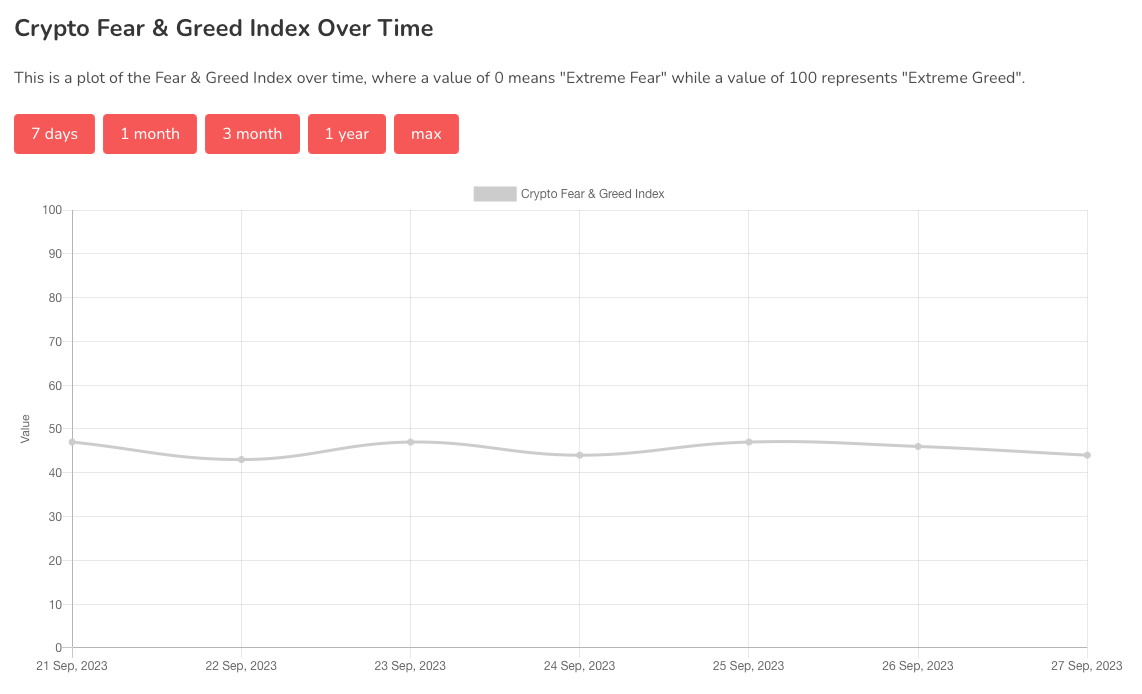
Chart #5 - Fear and Greed Index
The Fear and Greed Index is sitting at 44 today, indicating Fear.
The highest the index has been over the past seven days is 47, and the lowest is 43.
Banter’s Take
Bitcoin is consolidating below its pivot level, indicating ongoing downside risk influenced by the stock market and the surging DXY.
Long-term investors should wait for better entry points, while short-term sellers might seek entry opportunities.
Stay safe my friends!
Go to our Crypto Banter Discord here where Sheldon and Kyle give updates on the charts and trades from The Daily Candle newsletter!