

📈📉 CAUTION! BRACE Yourselves for NEW ATHs!
📈📉 CAUTION! BRACE Yourselves for NEW ATHs!
PLUS: 20% GAINS on THIS Trade!
Overview
Chart #1 - Sei (SEIUSDT) 12-Hour
Chart #2 - Pyth Network (PYTHUSD) 8-Hour
Chart #3 - Illuvium (ILVUSDT) 8-Hour
Chart #4 - DyDx (DYDXUSDT) 6-Hour
Chart #5 - Fear and Greed Index
Our Trades Are Printing PROFIT!!!
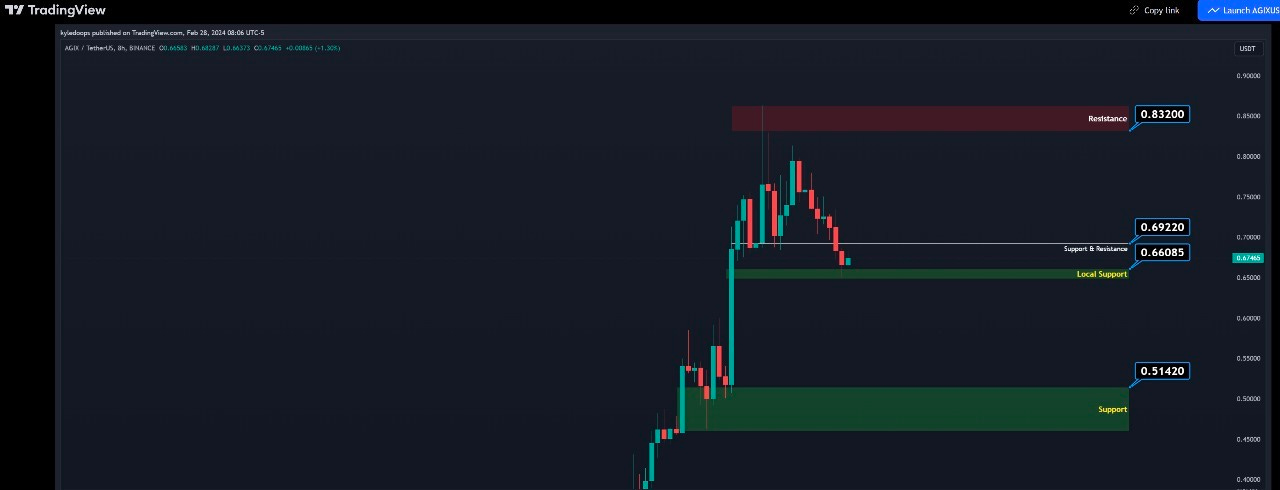
Yesterday we gave our SingularityNET (AGIX) trade.
Since then, it has all gone according to plan!
Check it out below. And if you want more like this, hit the subscribe button below! 👇
How it started…
How it’s going…
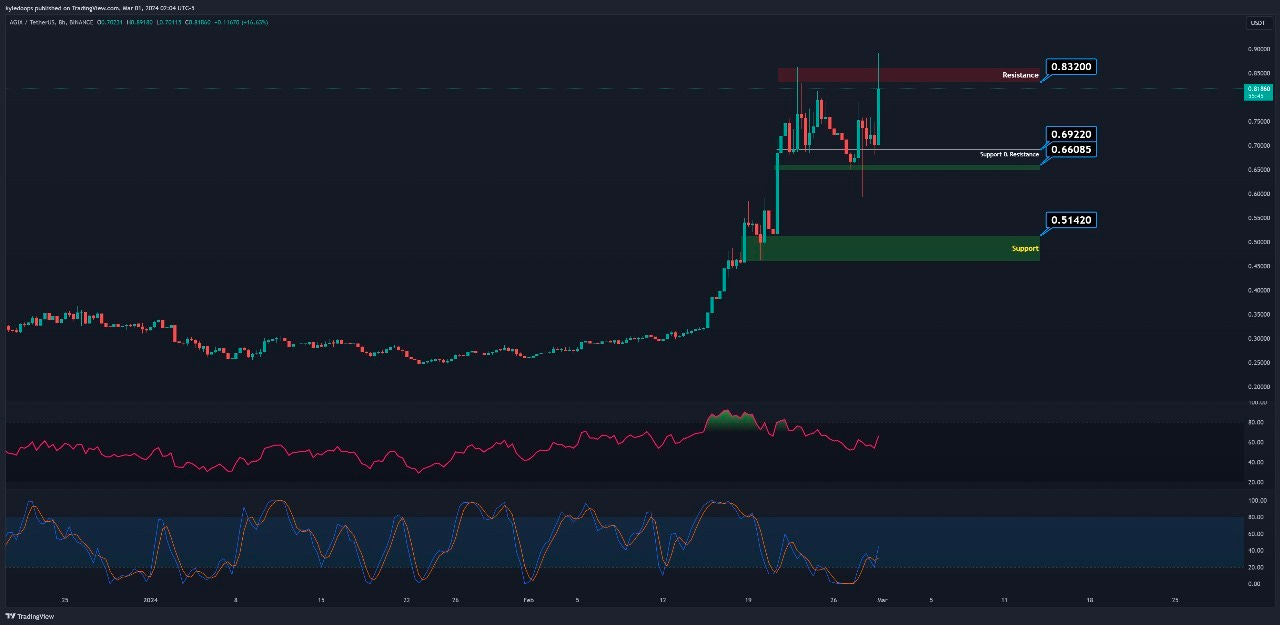
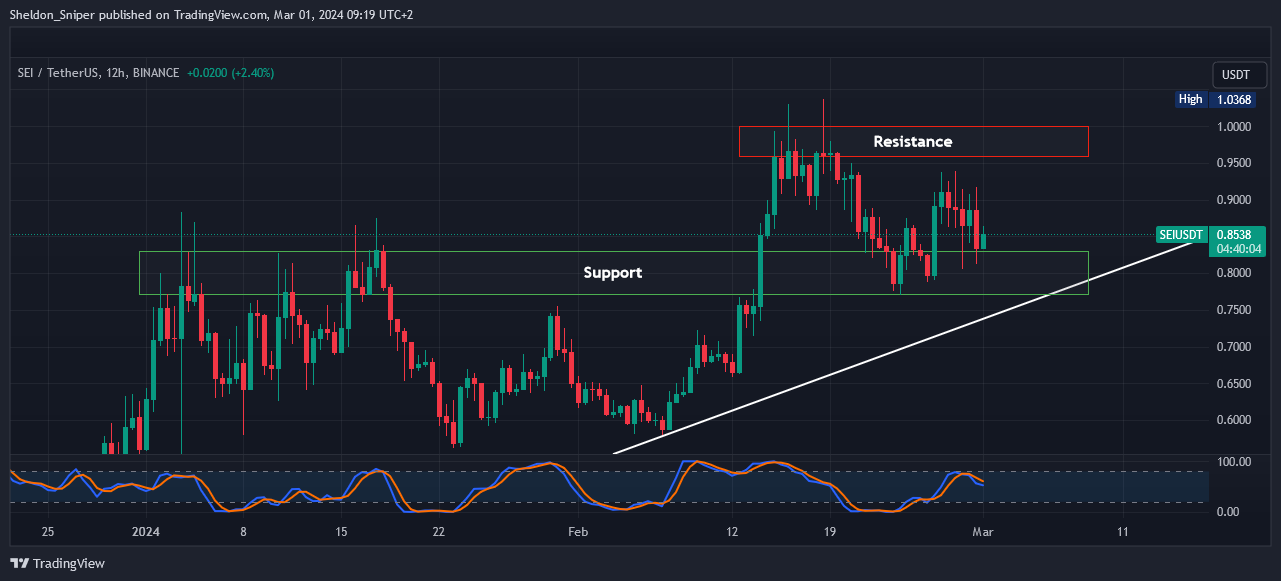
Chart #1 - Sei (SEIUSDT) 12-Hour
Chartist: Sheldon
(For the chart screenshot, click here.)
SEI went into “price discovery”, and is currently testing an area of resistance of $0.77 - $0.83. I will be adding to my position on Bybit in this area, with the view of further upside over the next couple of weeks.
Entry: Laddering into my spot position between $0.77 - $0.83.
Take Profits:
TP1 - Target is the next resistance of $0.96 - $1.00, where I will sell 25%.
The balance I will leave to run.
Stop Loss: Just below the white support line, slightly below the $0.70 price point.
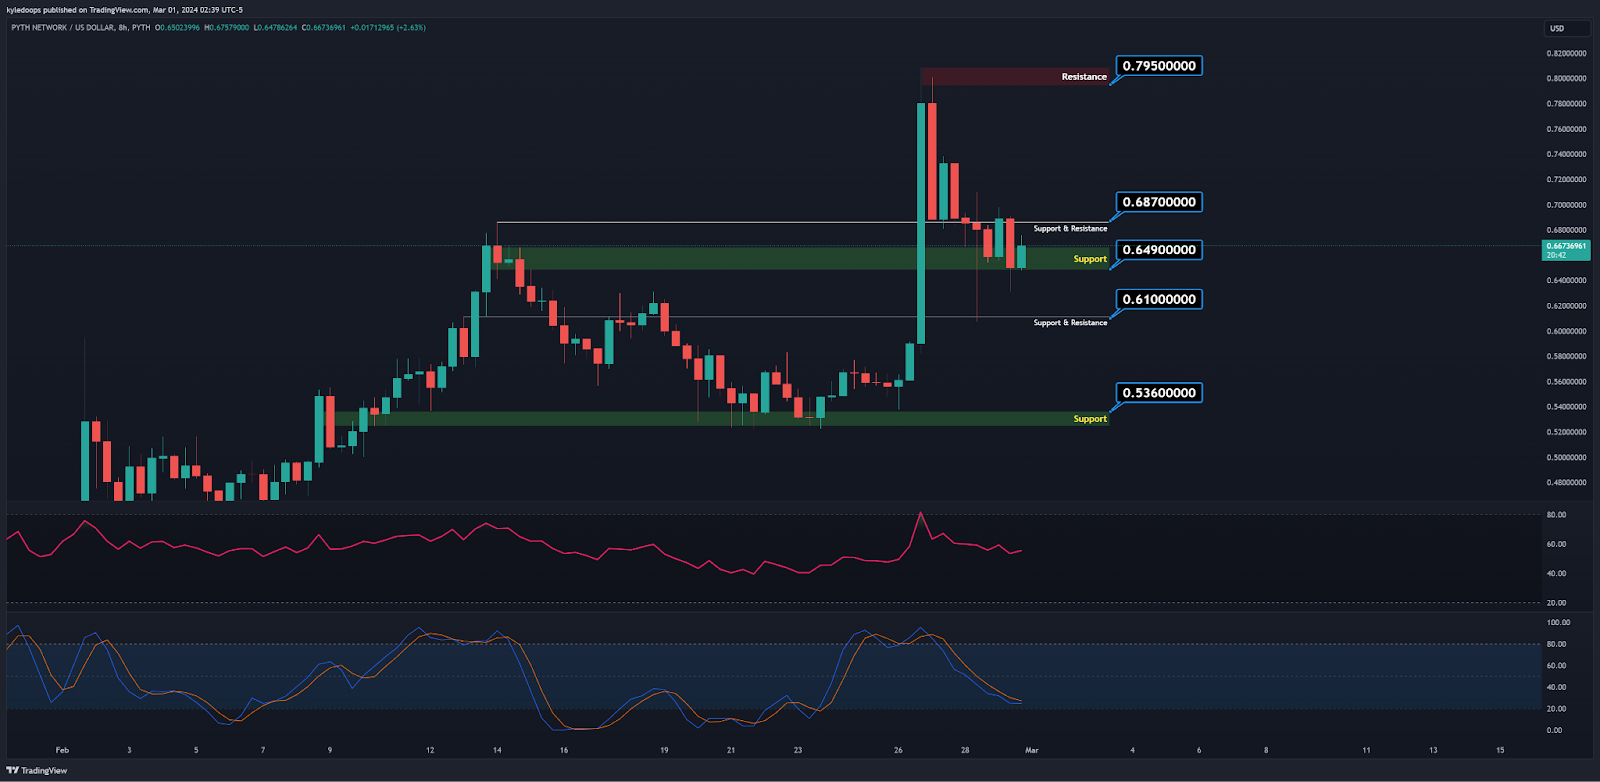
Chart #2 - Pyth Network (PYTHUSD) 8-Hour
Chartist: Kyle
(For the chart screenshot, click here.)
PYTH is building a support structure at $0.649 and potentially preparing for the next run up, targeting resistance at $0.795.
The crucial level here is $0.687 which previously acted as pivot point. It needs to claim and hold it.
In the chance it drops it could head to$0.536.
Claim your Bitget sign-up bonuses here (details below).

Outsmart 99% Of The Market!
Get full access into our Discord And Telegram group, where you'll find all of our premium content!
👉 Trade Signals!
👉 Trade Set-Ups!
👉 Trading Challenges!
👉 Education!
👉 SO MUCH MORE!
Chart #3 - Illuvium (ILVUSDT) 8-Hour
Chartist: Kyle
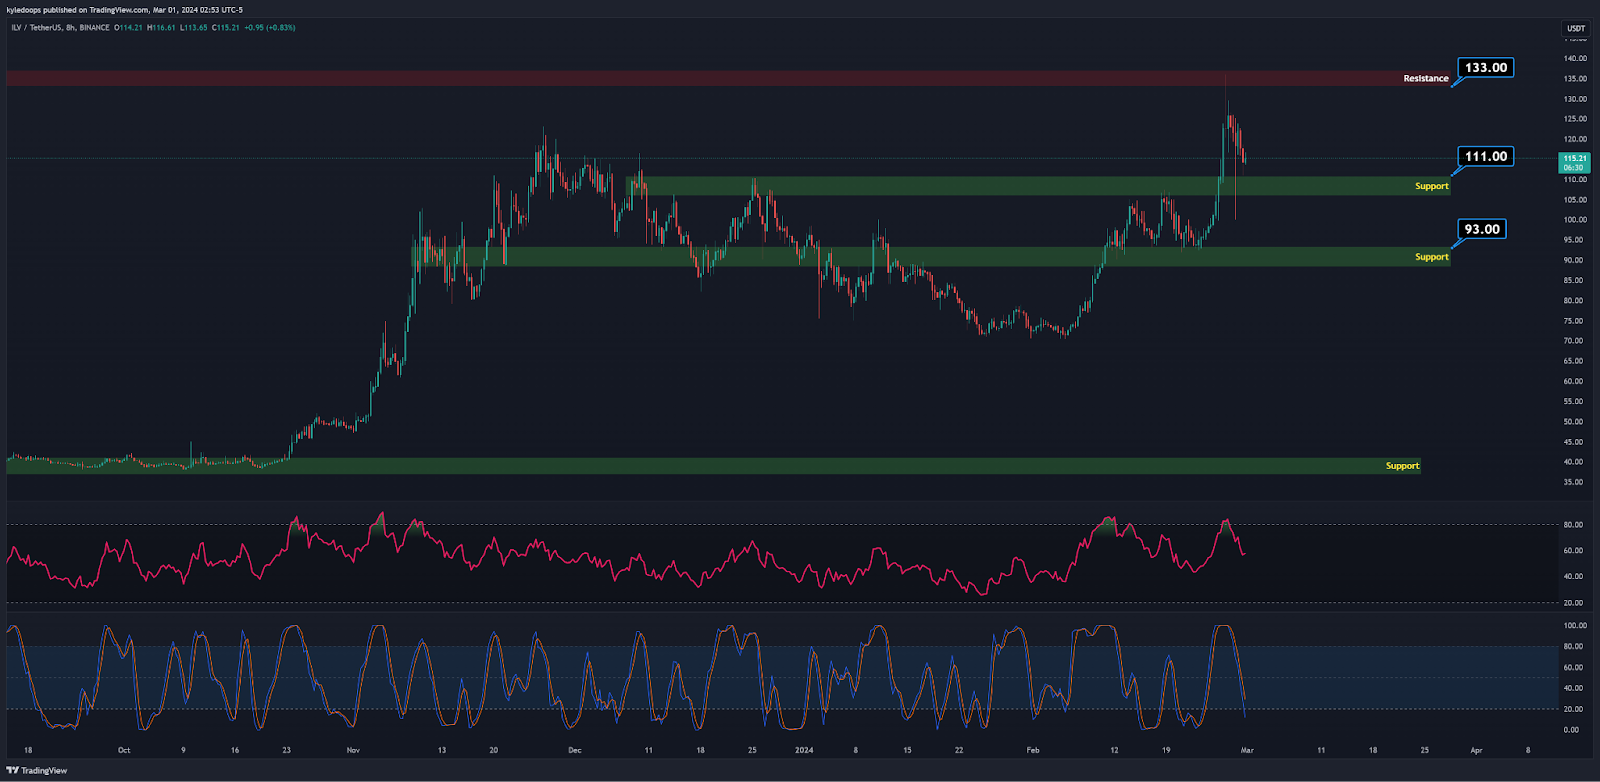
(For the chart screenshot, click here.)
ILV is hovering above a previous resistance which recently converted to support.
There is a strong chance it retests $111 before targeting $133. When it does we are in for a nice 20% move.
The next support is at $93.
Claim your Bitget sign-up bonuses here (details below).
Chart #4 - DyDx (DYDXUSDT) 6-Hour
Chartist: Sheldon
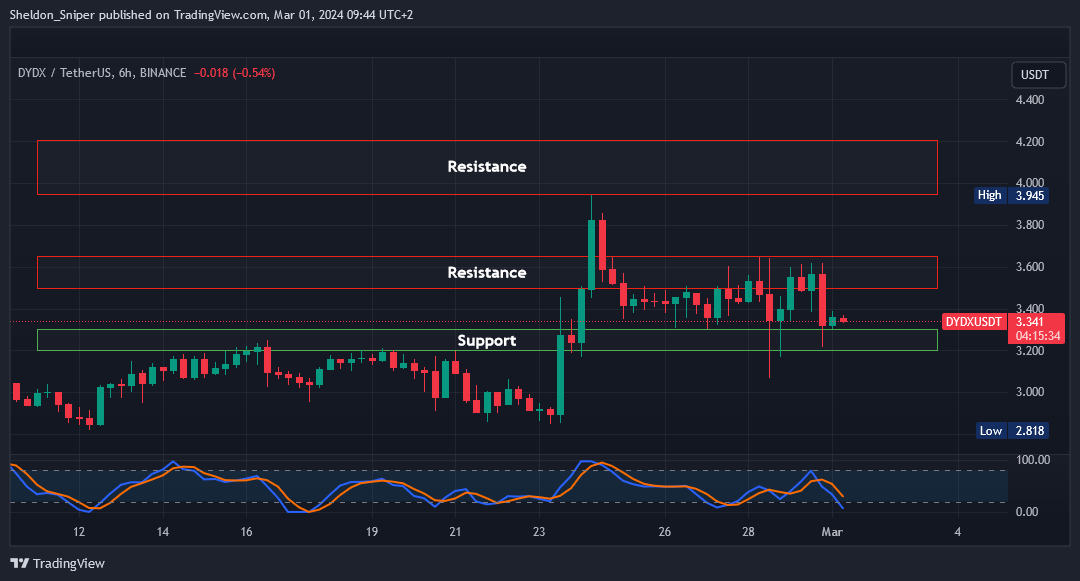
(For the chart screenshot, click here.)
DYDX has retraced down into the $3.20 - $3.30 area of major support, where I will be laddering into a trade, with the plan of taking profits at the next areas of resistance.
Entry: Laddering into my spot position between $3.20 - $3.30.
Take Profit (TP):
TP1 - My target is between $3.50 - $3.65, where I will sell 25%.
TP2 - I will sell the remaining 75% between $3.94 - $4.20.
Stop Loss: I’ll set this just below $3.00.
Claim your Bitget sign-up bonuses here (details below).
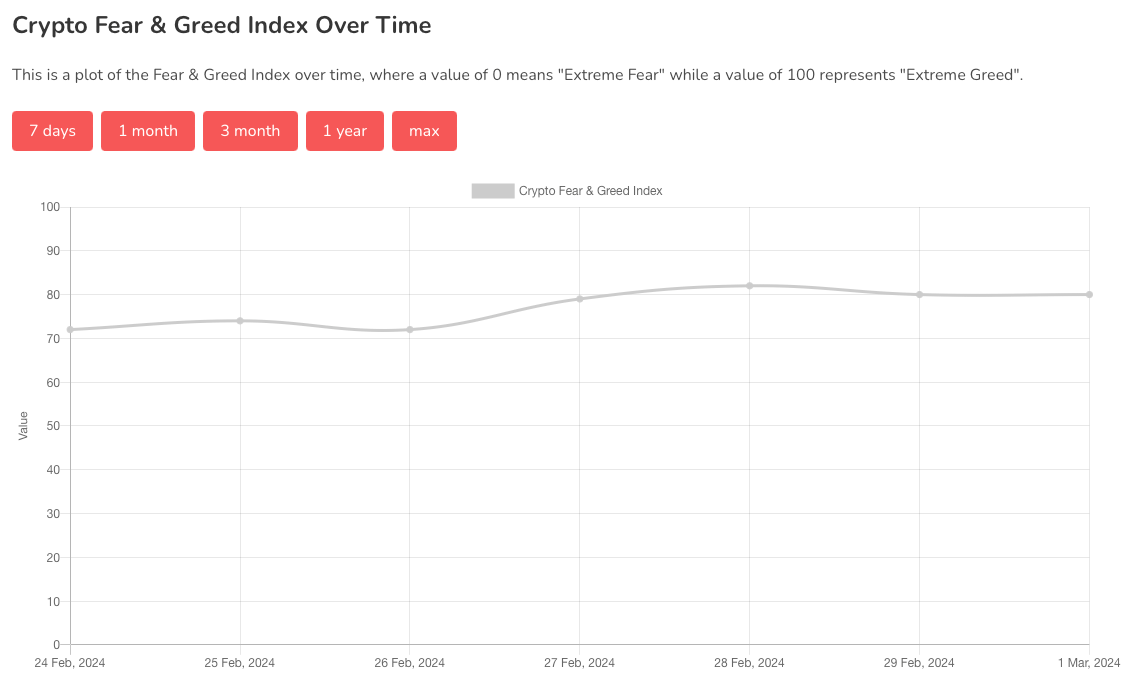
Chart #5 - Fear and Greed Index
The Fear and Greed Index is sitting at 80 today, indicating Extreme Greed.
The highest the index has been over the past seven days is 82, and the lowest is 72.
Banter’s Take
Bitcoin appears to have found strong support at $60,700 and needs to hold above this level so we can start thinking that we are out of danger.
The total market cap has stabilized above $2.2 trillion, of which $1.2 trillion is Bitcoin's market cap, which was at its all-time high (ATH) during the previous bull run (November 2021).
Passing this level, we are officially heading towards a new ATH... brace yourselves.
Stay safe my friends!
Go to our Crypto Banter Discord here where Sheldon and Kyle give updates on the charts and trades from The Daily Candle newsletter!