

📈📉 CAUTION! Rotating Into ETH Now is a MISTAKE!
📈📉 CAUTION! Rotating Into ETH Now is a MISTAKE!
Many Analysts are Predicting a Bear Market!
Overview
Chart #1 - Solana (SOLUSDT) 3-Day
Chart #2 - Ethereum to Bitcoin Dominance (ETHBTC) Daily
Chart #3 - S&P 500 Futures (ES1!) Daily
Chart #4 - USDT Dominance (USDT.D) Weekly
Chart #5 - Fear and Greed Index

Chart #1 - Solana (SOLUSDT) 3-Day
Chartist: Sheldon
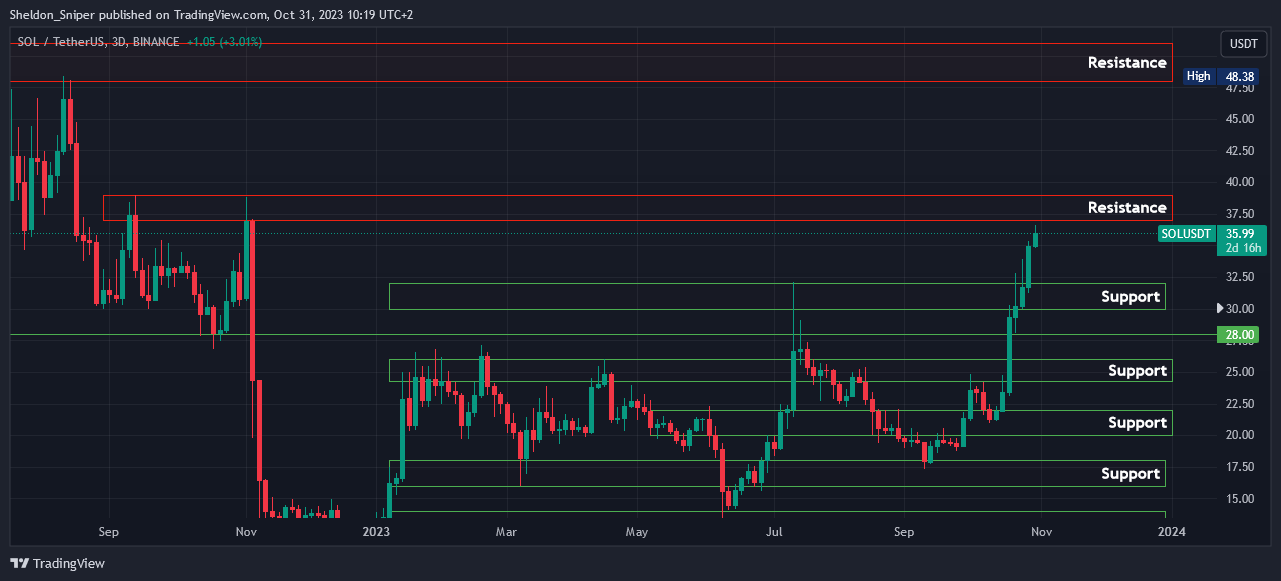
(For the chart screenshot, click here.)
The price of SOL has almost reached the $37 - $39 area of major resistance, the same area where the price was rejected in September and at the end of October last year.
The price is currently trading at around $36.00.
With the Solana Conference starting today, there is definitely more risk of a possible pullback in price at some stage, after the massive run-up over the last two weeks.
But, the price can also continue to the upside!
If the $39 resistance level is broken, then the next area of resistance is higher up at $48 to around $50. If the price gets rejected in this area, then the next support is at $30.00 - $32.50.
Sign-up and trade on Bybit today.
Exclusive $30,000 deposit rewards and bonuses up for grabs!
Chart #2 - Ethereum to Bitcoin Dominance (ETHBTC) Daily
Chartist: Kyle
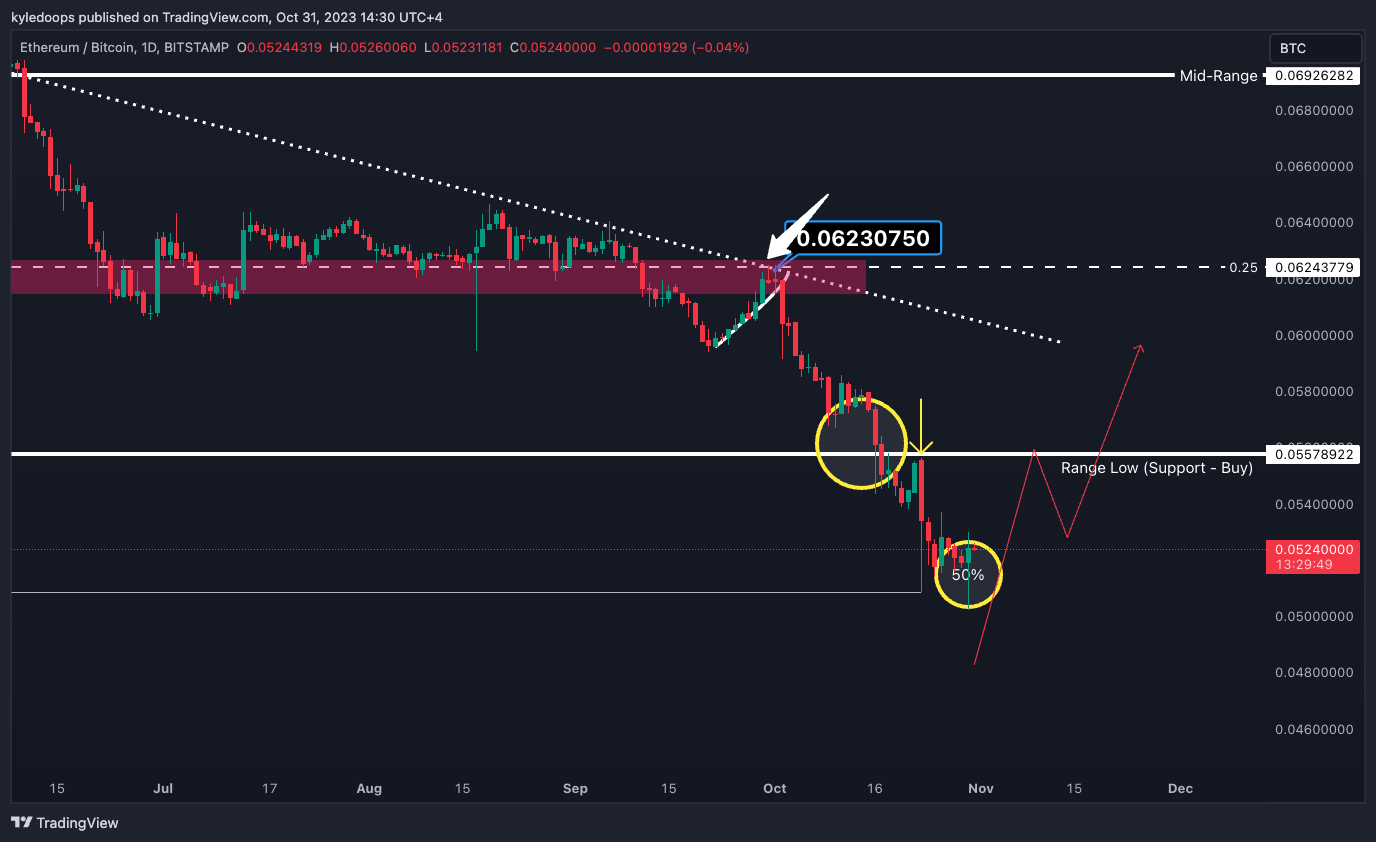
(For the chart screenshot, click here.)
ETH/BTC is reacting to the circle labeled 50%. As a reminder, we highlighted this area due to the prior wick from months ago, which had a significant amount of liquidity.
It's still too soon to rotate into ETH. We don't have enough information, and we'd need to see 0.055 reclaimed to more confidently confirm that it's time to transition from BTC to ETH.
Monitor the 0.0557 level closely to determine if it's reclaimed or if there's a rejection at that level.
Claim your Bitget sign-up bonuses here (details below).

For more premium content like this, be sure to take advantage of our limited offer to the Whale Room Discord at 25% off for the first 3-months.
Apply the promo code “DOOPS”.
Limited to the first 50 people!
Chart #3 - S&P 500 Futures (ES1!) Daily
Chartist: Kyle
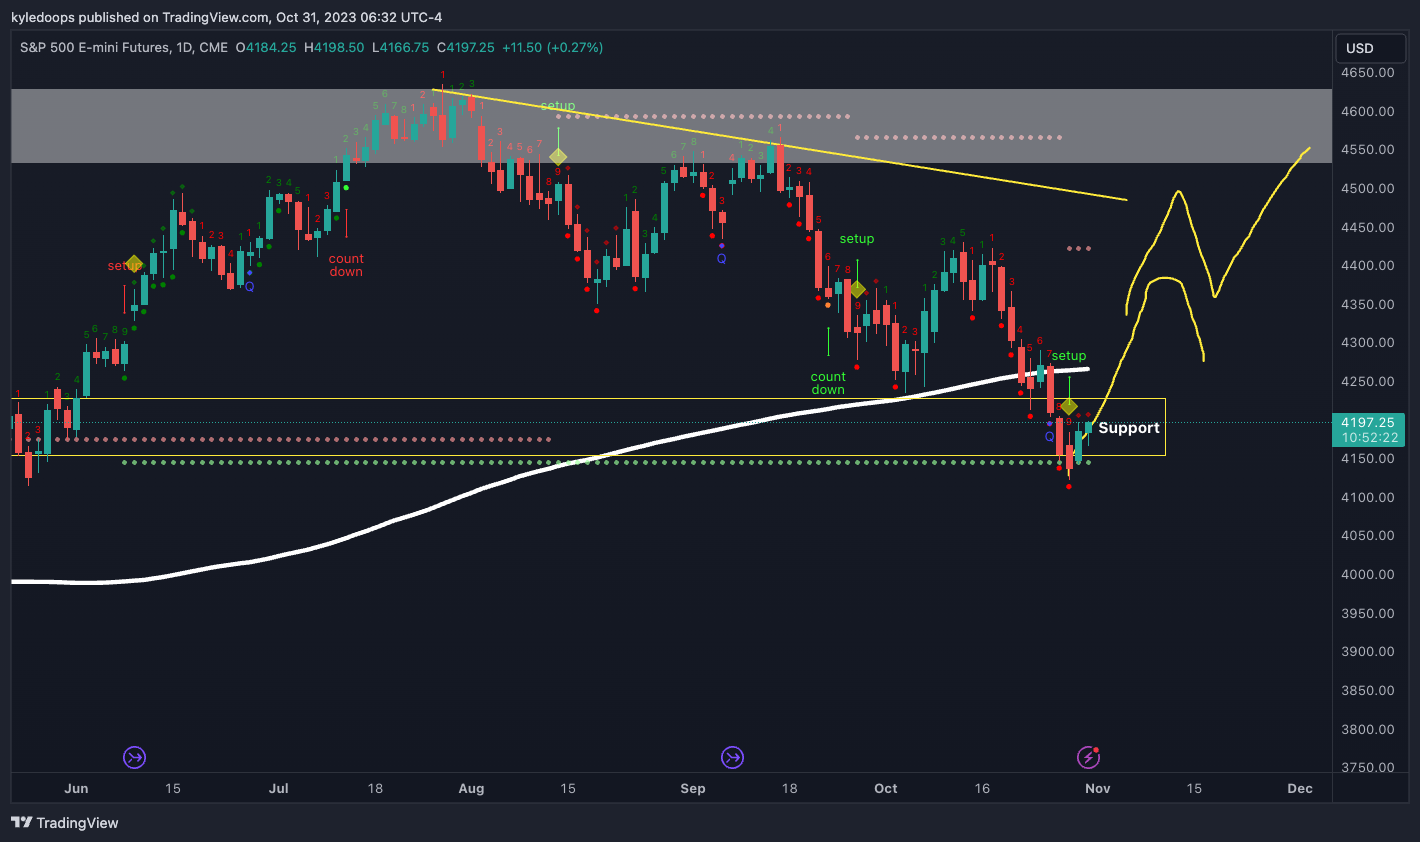
(For the chart screenshot, click here.)
The S&P 500 is beginning its movement away from the evident support.
Bulls aim to swiftly reclaim the 4,300 level and maintain it; this level represents the 200-day Moving Average (MA). As of now, the situation isn't entirely bleak for the bulls, as the 200 MA still tilts upward.
As the price experiences a bounce, be vigilant for a potential lower high. A lower high could signal that the bears might drive the price down again.
In contrast, a higher high indicates that the price is ranging instead of trending. In that scenario, anticipate a price range to establish between 4,200 and 4,600.
Claim your Bitget sign-up bonuses here (details below).
Chart #4 - USDT Dominance (USDT.D) Weekly
Chartist: Sheldon
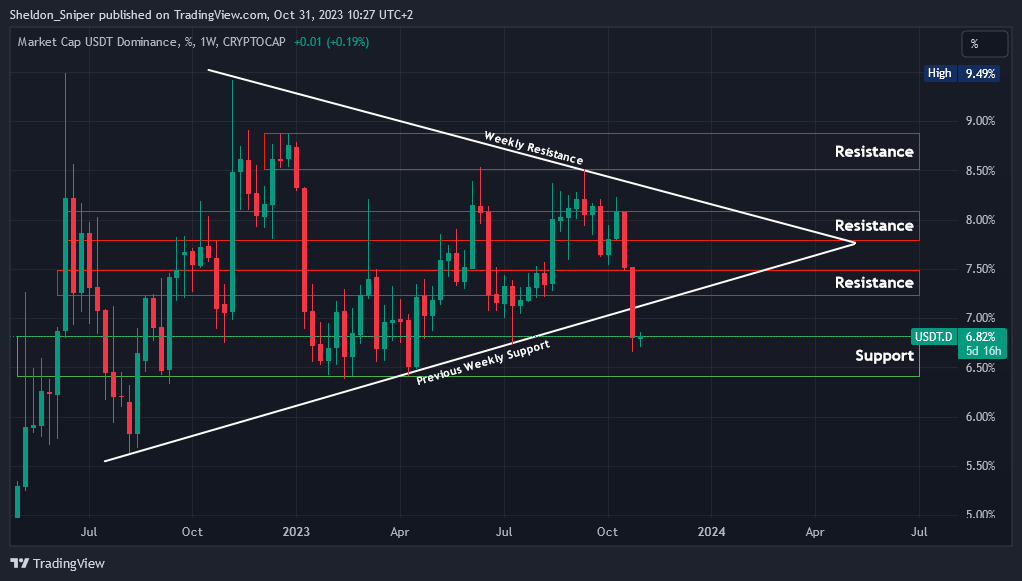
(For the chart screenshot, click here.)
Last week, USDT.D broke through its weekly support trend line, which has been in place since August 2022, as the entire market rallied to the upside.
USDT.D is currently at the 6.80% level of support. I expect a move back up after two weeks of significant downside. Such a move could retest both the break of the previous support and the next resistance level at around 7.25%, which would be bearish for the trading market.
If USDT.D continues downward, then the next support is at the bottom of the range support at 6.40%.
Claim your Bitget sign-up bonuses here (details below).

🚀 Sniper School's New Cohort Begins November 7th!
Sniper School is a free 3-week trading course led by Sheldon. Dive deep into his strategies and insights to master the art of trading. Equip yourself with the skills to capitalize on market shifts and maximize your gains.
Limited Seats! With only 3,000 seats available, our waitlist fills up rapidly! Secure Your Seat Today!
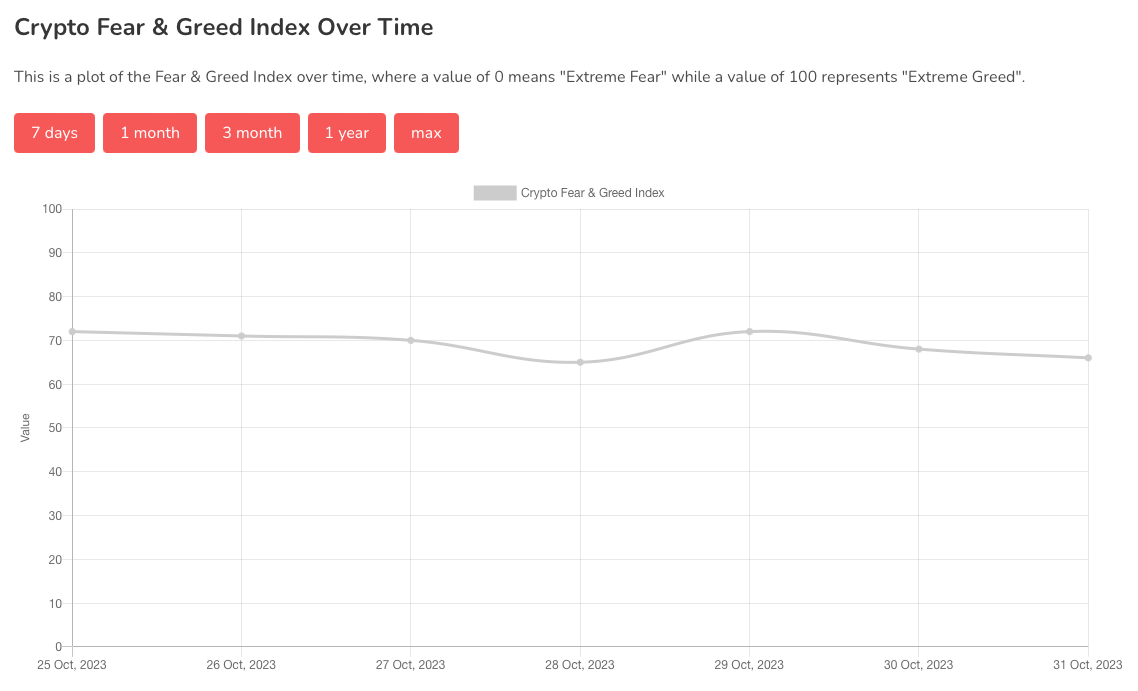
Chart #5 - Fear and Greed Index
The Fear and Greed Index is sitting at 66 today, indicating Greed.
The highest the index has been over the past seven days is 72, and the lowest is 65.
Banter’s Take
The stock market is currently a source of concern for many, with numerous analysts predicting a potential bear market. However, a more likely scenario is that prices will range between 4,200 and 4,600.
Stay safe my friends!
Go to our Crypto Banter Discord here where Sheldon and Kyle give updates on the charts and trades from The Daily Candle newsletter!