

📈📉 CFX and MKR Long Trade Setups!
📈📉 CFX and MKR Long Trade Setups!
PLUS: Will BTC Close the CME Gaps?
Overview
Chart #1 - Bitcoin CME Futures Hourly
Chart #2 - Conflux (CFXUSD) Daily
Chart #3 - Maker (MKRUSDT) Daily
Chart #4 - The Sandbox (SANDUSDT) Daily
Chart #5 - Fear and Greed Index
Chart #1 - Bitcoin CME Futures Hourly
Chartist: Sheldon
(For the chart screenshot, click here.)
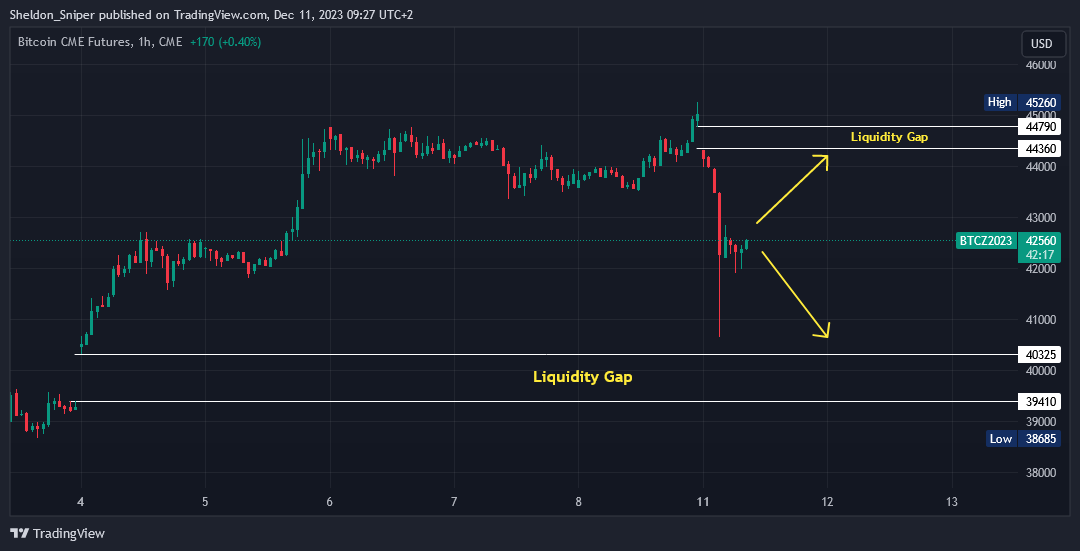
A lot of large BTC and ETH traders use the Chicago Mercantile Exchange (CME) to trade on. This exchange only trades from Monday to Friday, yet the rest of the market trades 24/7. Occasionally, a "Liquidity Gap" is formed, and the BTC price closes on a Friday and opens on a Monday, and these "Gaps" tend to get filled over time.
Last weekend, there was a "Liquidity Gap" left behind between $39,410 - $40,325, and this past weekend there was a smaller one between $44,360 - $44,790.
BTC retraced overnight, finding support at around $40,675, before moving higher to $42,560.
I feel it might close the higher gap, but I do think then it will continue down to close the lower one.
Sign-up and trade on Bybit today.
Exclusive $30,000 deposit rewards and bonuses up for grabs!
Chart #2 - Conflux (CFXUSD) Daily
Chartist: Kyle
(For the chart screenshot, click here.)
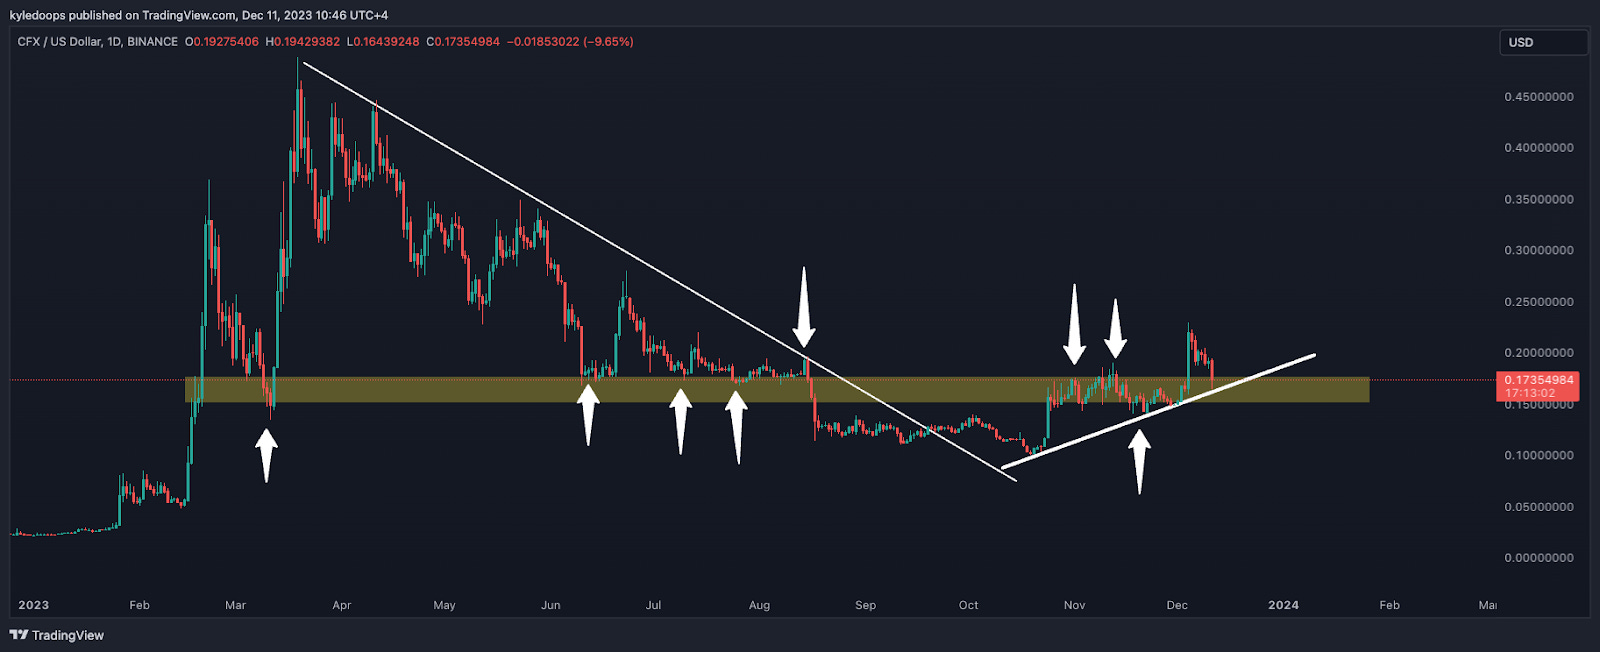
CFX could be flipping a clear level into support here.
I'd look to build a long here with my stop below the prior lows at $0.147.
In a longer-term trend, this could get us to $0.43.
Claim your Bitget sign-up bonuses here (details below).

Outsmart 99% Of The Market!
Get full access into our Discord And Telegram group, where you'll find all of our premium content!
👉 Trade Signals!
👉 Trade Set-Ups!
👉 Trading Challenges!
👉 Education!
👉 SO MUCH MORE!
Chart #3 - Maker (MKRUSDT) Daily
Chartist: Kyle
(For the chart screenshot, click here.)
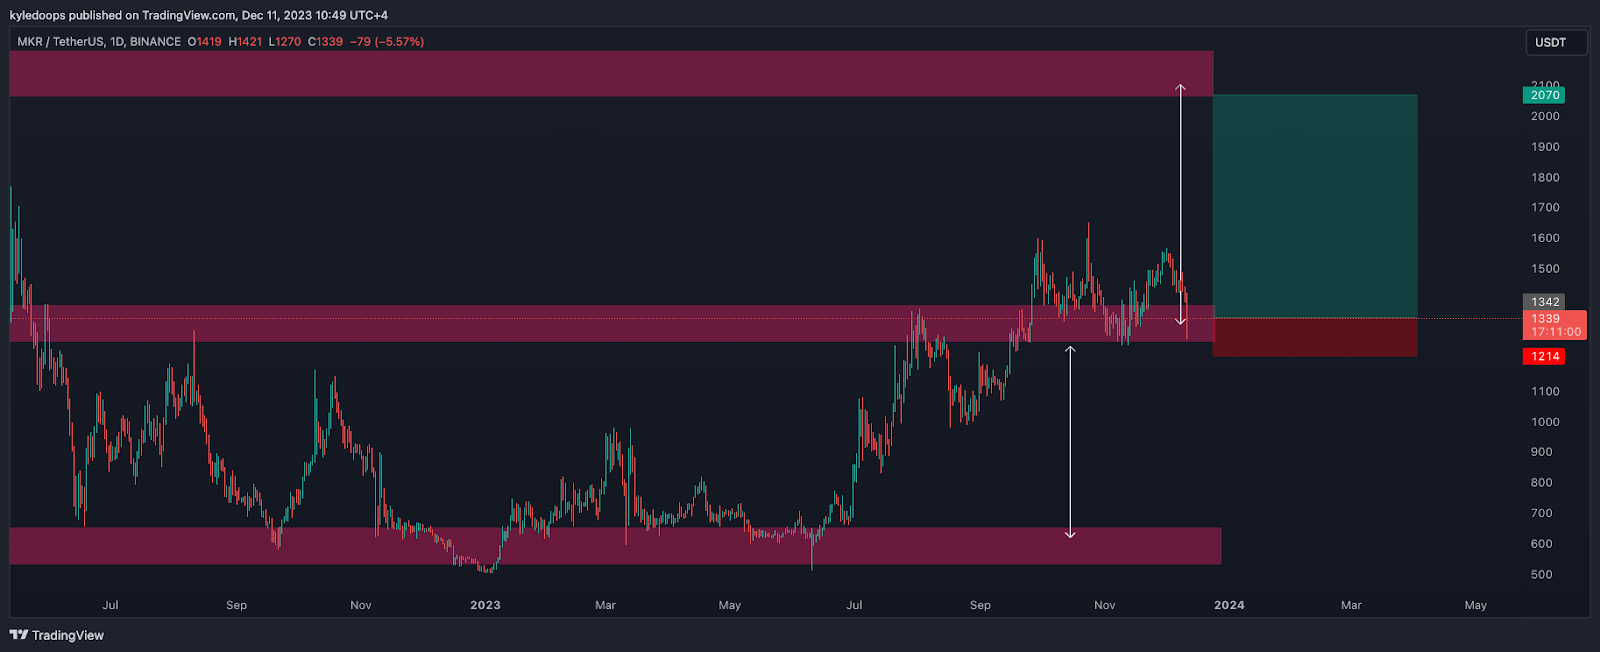
I’m taking a long here with my stop at $1,214 and Take Profit (TP) at $2,070.
The basis of this is that we're flipping resistance into support. So, the mid-range should now be the new support, and we can therefore target range highs.
Claim your Bitget sign-up bonuses here (details below).
Chart #4 - The Sandbox (SANDUSDT) Daily
Chartist: Sheldon
(For the chart screenshot, click here.)
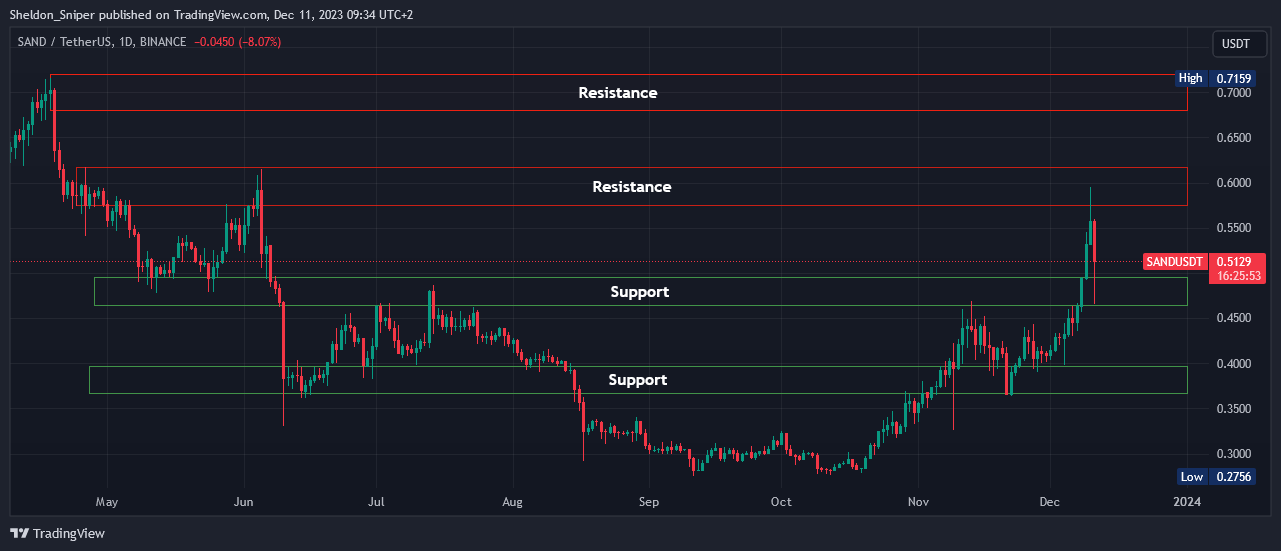
I believe SAND is correcting, and could move higher from here to test the $0.5750 resistance, before coming down to test the $0.4650 - $0.50 area of support.
Once BTC stabilizes, there is a chance of an alt run, which could take SAND to $0.5750 - $0.62, followed by $0.6750 - $0.72.
Claim your Bitget sign-up bonuses here (details below).
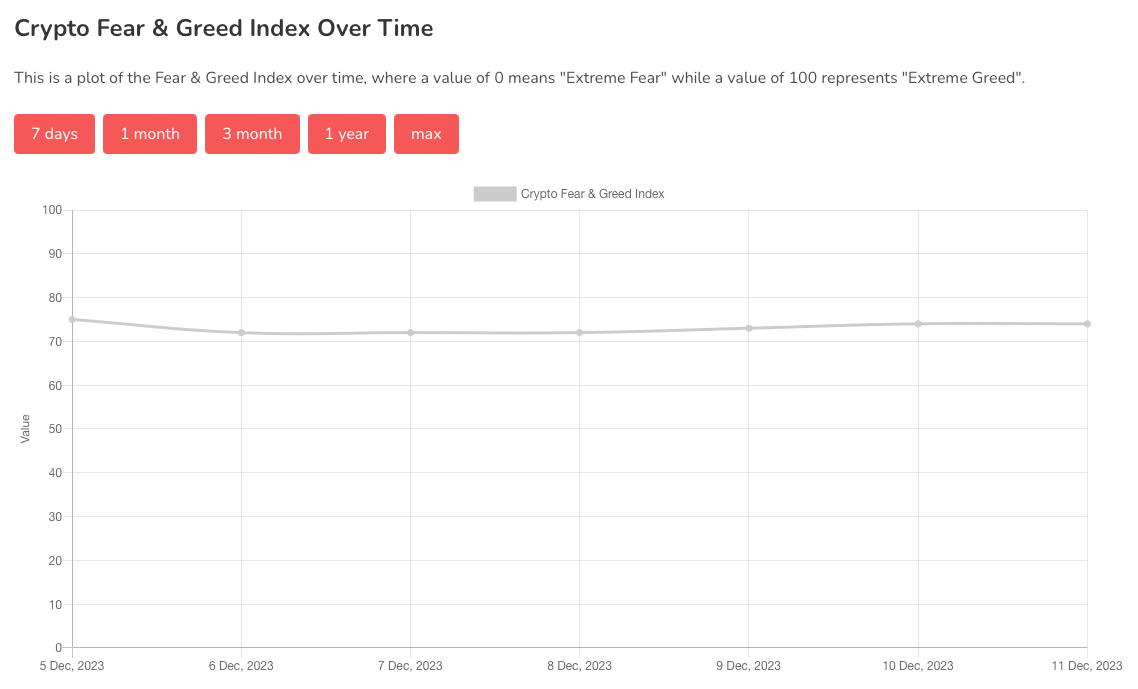
Chart #5 - Fear and Greed Index
The Fear and Greed Index is sitting at 74 today, indicating Greed.
The highest the index has been over the past seven days is 75, and the lowest is 72.
Banter’s Take
The market is experiencing a pullback, but many altcoins are lining up for potential long positions with decent support backing the trade.
It's necessary to wait for today's daily close to be sure of what comes next.
Stay safe my friends!
Go to our Crypto Banter Discord here where Sheldon and Kyle give updates on the charts and trades from The Daily Candle newsletter!