

📈📉 Crash-Proof Your Portfolio with THESE 4 Alt Trades!
📈📉 Crash-Proof Your Portfolio with THESE 4 Alt Trades!
😨 $55K BTC Is Still In Play!
Overview
Chart #1 - THORChain (RUNEUSDT) 8-Hour
Chart #2 - Sui (SUIUSD) Daily
Chart #3 - Avalanche (AVAXUSDT) Daily
Chart #4 - Solana (SOLUSDT) 12-Hour
Bullish Breakout: Bitcoin’s Call Butterfly Opportunity for Traders: With Deribit’s Anand
Here’s today’s secret code: FOEWMLUD
What’s a secret code? Oh, well you use it to gain extra entries to our Win An ETH draw we are running over on our Good Morning Crypto newsletter.
It takes 30 seconds to enter!
Check it out here!

Chart #1 - THORChain (RUNEUSDT) 8-Hour
Chartist: Sheldon

(For the chart screenshot, click here.)
RUNE got rejected at the top of the range support, and has started to retrace.
This could possibly provide an entry into a long trade at the bottom of the area of support.
Entry: If price comes down to test the bottom of the range support, at around $7.00, enter into a long spot trade.
Take Profit (TP):
TP1: Take a small bit off the table, once price reaches the top of the range support at around $8.00 (14%)
TP2: $9.30 - $10.00 (33% - 43%)
TP3: $11.25 - $12.00 (61% - 71%)
Stop Loss: A tight stop loss just below $6.85
Please not that at this stage we are not sure if BTC will resume its retrace to test lower levels of support. Please manage your risk tightly over the next few days.
Sign-up and trade on Bybit today.
Exclusive $30,000 deposit rewards and bonuses up for grabs!
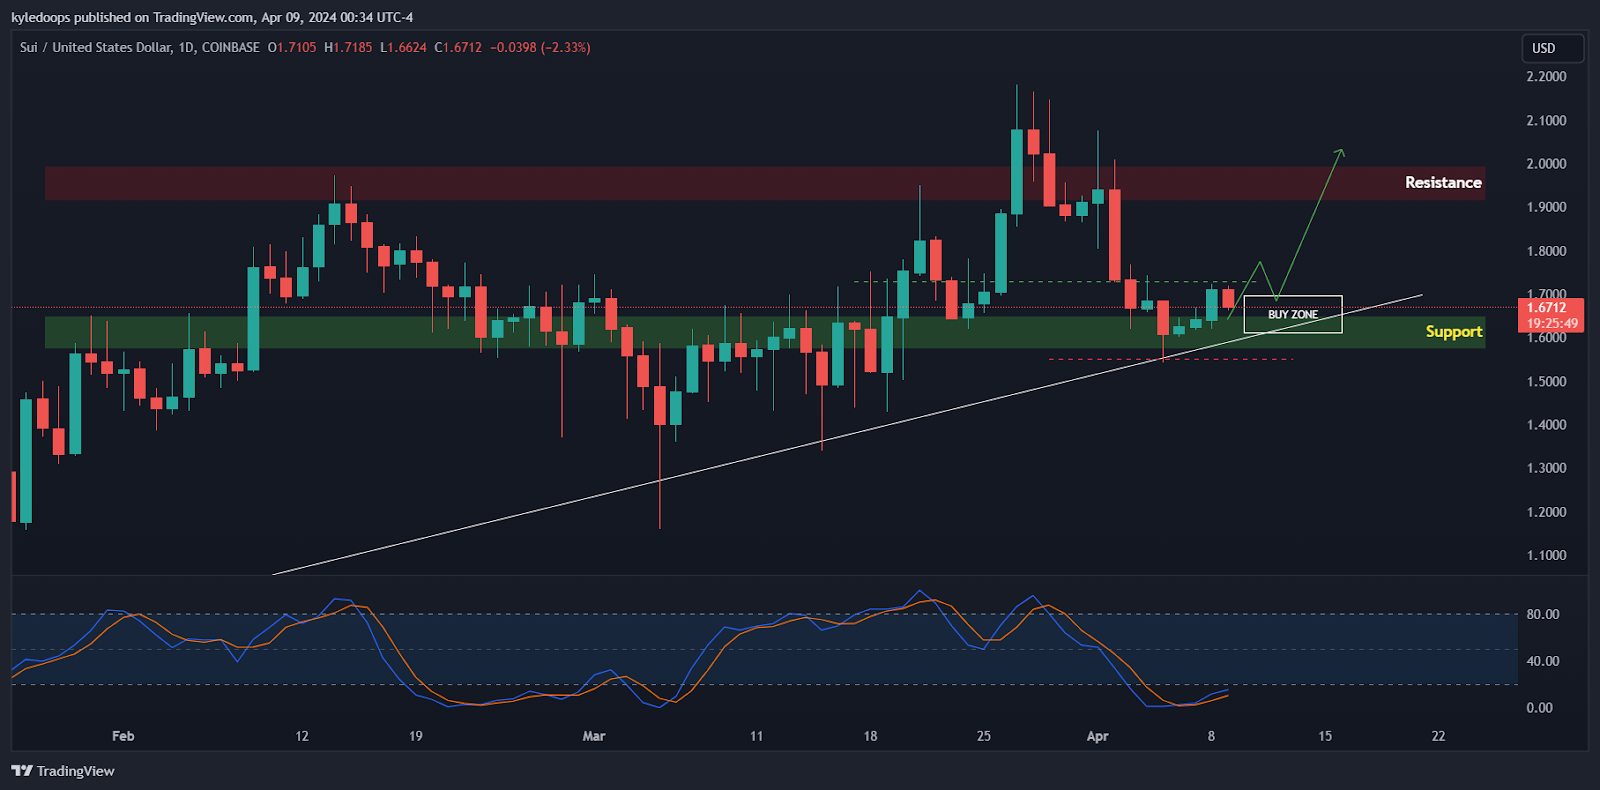
Chart #2 - Sui (SUIUSD) Daily
Chartist: Kyle
(For the chart screenshot, click here.)
A SUI conference is taking place this week in Paris which could lead to a buy the rumour sell the news event.
Watch price within the current zone. Price closing above $1.7 could indicate a move towards top of the range. Beyond that is price discovery.
Gaining entry in the buy zone will offer a great R:R when you can add to the trade on price consolidating above the resistance line.
Entry: $1.6 to $1.73
Take Profit (TP):
TP1: $1.95
TP2: $2.35
TP3: $3
Stop Loss: $1.55
Claim your Bitget sign-up bonuses here (details below).

Outsmart 99% Of The Market!
Get full access into our Discord And Telegram group, where you'll find all of our premium content!
👉 Trade Signals!
👉 Trade Set-Ups!
👉 Trading Challenges!
👉 Education!
👉 SO MUCH MORE!
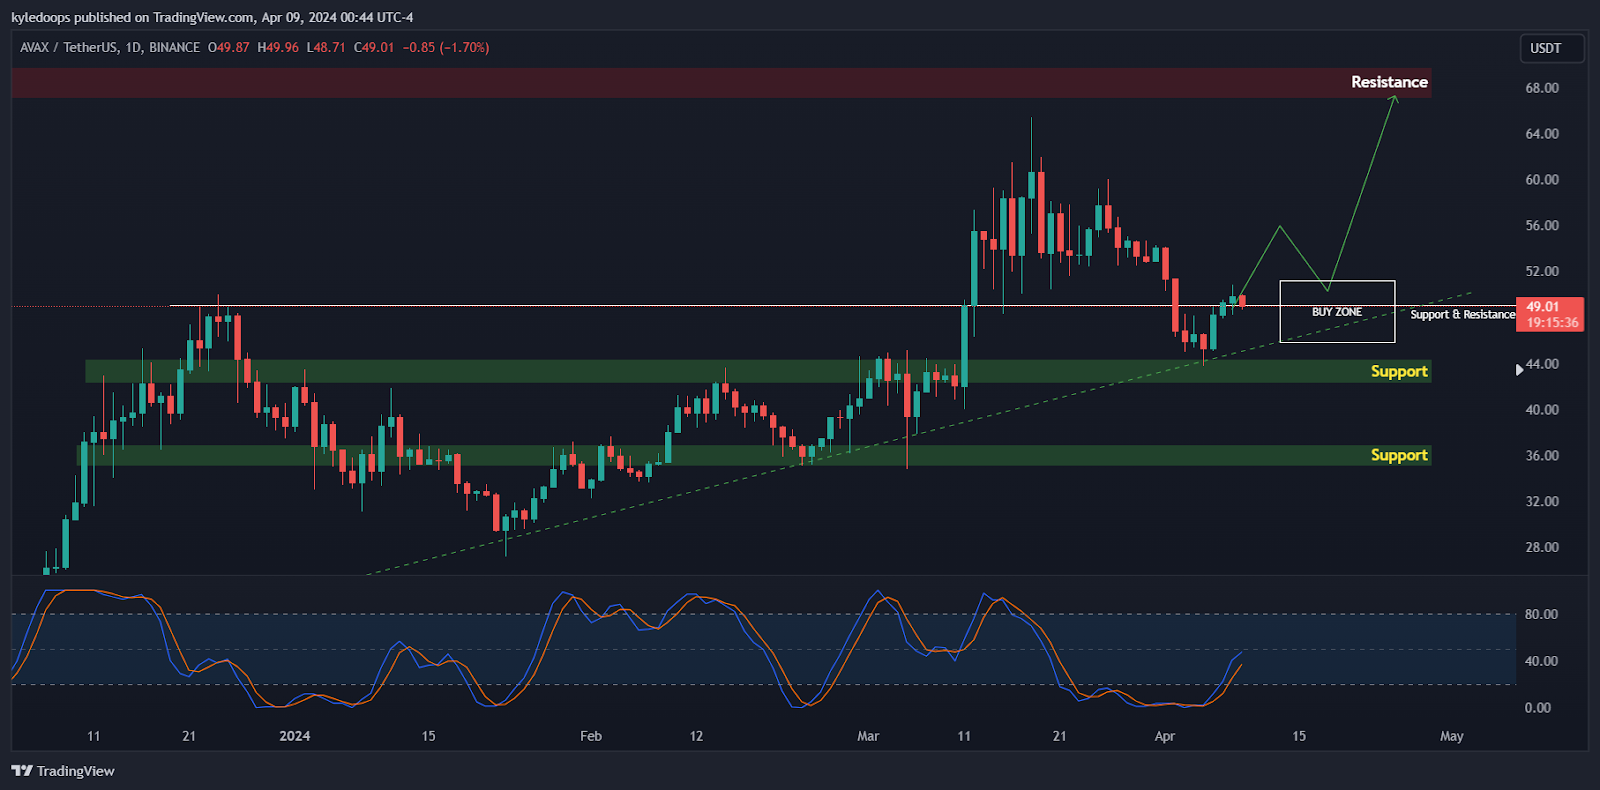
Chart #3 - Avalanche (AVAXUSDT) Daily
Chartist: Kyle
(For the chart screenshot, click here.)
AVAX is looking for acceptance either above or below $50.
Breaking above $50 and holding it as support gives sentiment that as long as the markets remain bullish we will get a trend continuation to then create a new high.
We’ll observe price action in this area and trade accordingly.
Entry: $51 to $46
Take Profit (TP):
TP1: $65
TP2: $80
TP3: $98.50
Stop Loss: Losing $45 on a HTF close
Claim your Bitget sign-up bonuses here (details below).
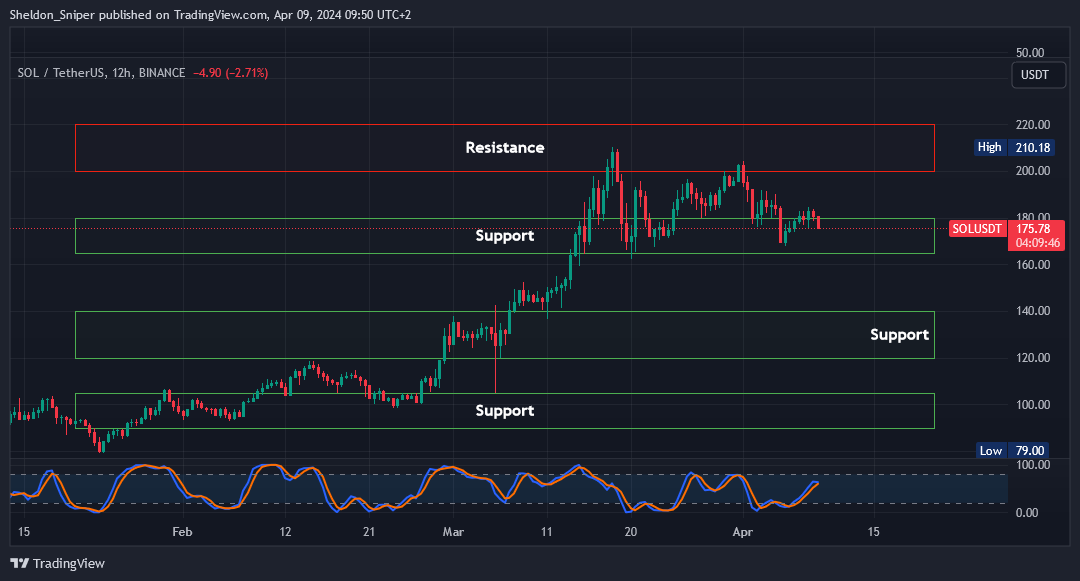
Chart #4 - Solana (SOLUSDT) 12-Hour
Chartist: Sheldon
(For the chart screenshot, click here.)
Many alts pumped in the last few days, but got rejected as this morning we started to see to get a market retrace.
SOL is still at support, but we need to see further price action in the market before entering into a trade. So:
Entry: If SOL comes down to retest the bottom of the range support at $165, we’ll enter into a long spot trade.
Take Profit (TP):
TP1: Take a small bit off the table, once price reaches the top of the range support at $180 (9%)
TP2: $200 - $220 (21% - 33%)
TP3: $240 - $260 (45% - 58%)
Stop Loss: A tight stoploss just below $160.00
Please not that at this stage we are not sure if BTC will resume its retrace to test lower levels of support. Please manage your risk tightly over the next few days.
Claim your Bitget sign-up bonuses here (details below).
Bullish Breakout: Bitcoin’s Call Butterfly Opportunity for Traders: With Deribit’s Anand
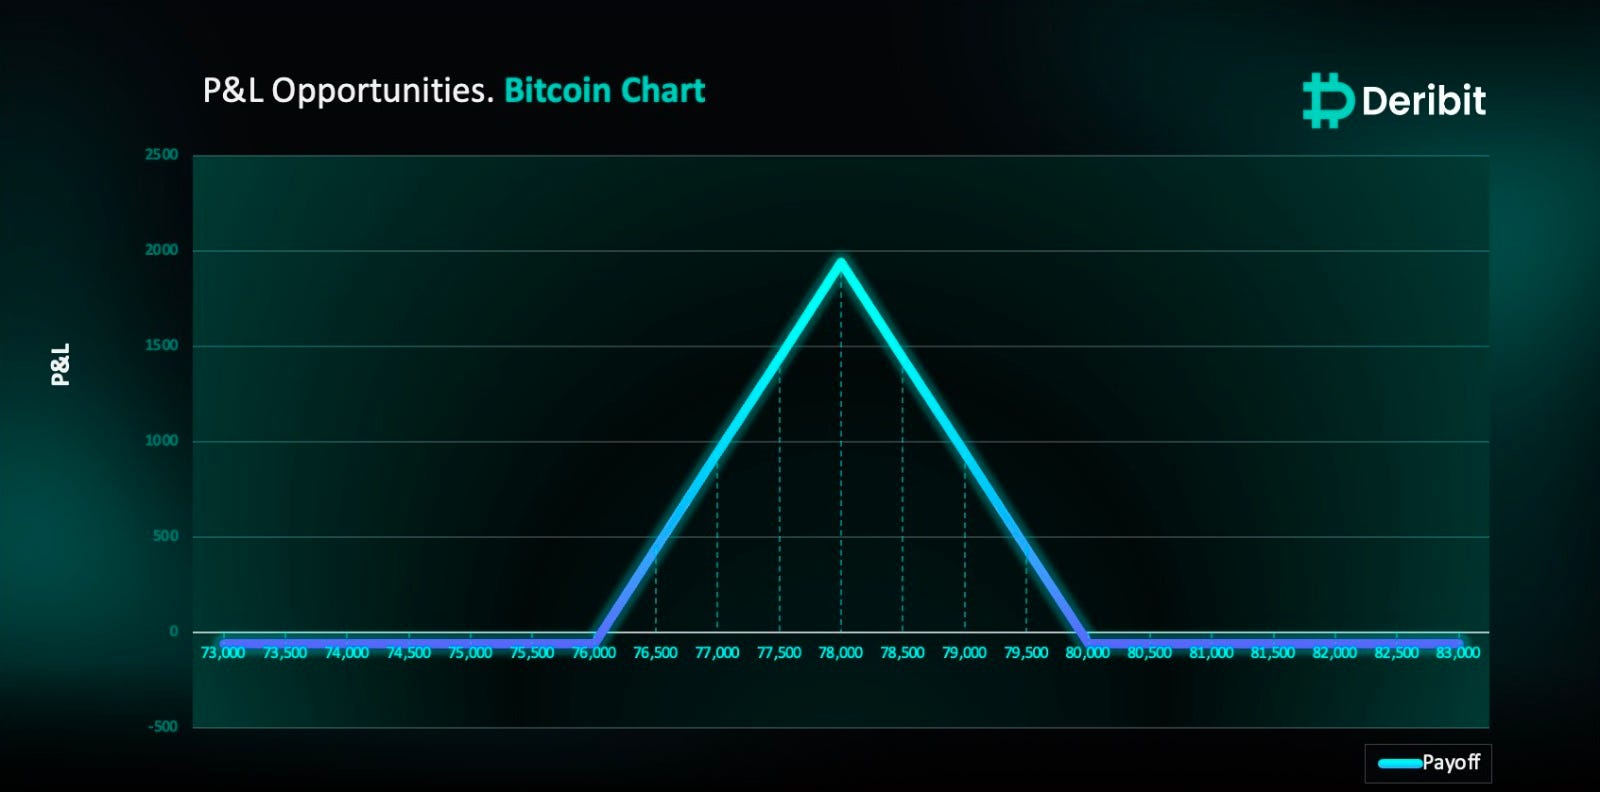
Bitcoin experienced a breakout from the symmetrical triangle with a good follow-through, suggesting bullish sentiment in the market. Our perspective remains optimistic for the bullish sentiments in the underlying. Additionally, we observed a significant increase in OI at the $78,000 strike for the 12th April expiry. Considering these factors, there is a potential for Bitcoin to make new highs. Hence, traders anticipating upward movement in the coming days might find the call butterfly strategy advantageous.
Trade Structure
(OTM Call) Buy 1x BTC-12APR24-$76,000-C @ $445
(OTM Call) Sell 2x BTC-12APR24-$78,000-C @ $260
(OTM Call) Buy 1x BTC-12APR24-$80,000-C @ $135
Payouts
Maximum Profit: $1,940/BTC
Debit of Strategy: $60/BTC
If the Bitcoin price is at $78,000 when the options expire on April 12th, traders will achieve maximum profit from this strategy.
Banter’s Take
Update from yesterday:
BTC retested the $73,000 mark. Nothing significant has changed yet. I anticipate a sweep of the highs before a decision on price direction is made. Should the price break above the $74,000 zone, it could trigger a short squeeze and lead to price discovery. The expectation then is for the price to consolidate, allowing Ethereum to break out against BTC. Historically, this pattern has occurred around the halving period, potentially leading to Ethereum outperforming BTC in the next cycle by up to 3x. Keep a close eye on the price this week, as BTC dropping to $55,000 is still a possibility.
Stay safe my friends!
Go to our Crypto Banter Discord here where Sheldon and Kyle give updates on the charts and trades from The Daily Candle newsletter!
How do buying these four coins protect or crash proof my profolio?