

Crypto Short Squeeze Incoming? Here's What We're Seeing..
Crypto Short Squeeze Incoming? Here's What We're Seeing..

Overview
Chart #1 - Cosmos (ATOM/USDT) Daily Chart
Chart #2 - Trias (TRIAS/USDT) Daily Chart
Chart #3 - Bitcoin (BTC/USD) Hourly Chart
Chart #4 - Injective (INJ/USDT) Daily Chart
Chart #5 - Fear and Greed Index

Chart #1 - Cosmos (ATOM/USDT) Daily Chart
Chartist: Sheldon

Cosmos (ATOM) is currently trading around $9.00 and is on a major support that has held over the last four weeks.
Price is oversold on higher timeframes which could lead to a potential move higher to test the upper range of the current support, at $9.50, and if there is more continuation, price could target the next area of resistance at $10.00 - $10.50.
If the $9.00 support level is lost, then price could possibly go and test the next area of support at $8.00 - $8.50.
There is a possibility of further downside in the BTC Dominance, and once that happens, I see some further upside in the General Altcoin Market, as cash leaves BTC and flows into the Alts.
Sign-up and trade on Bybit today.
Exclusive $30,000 deposit rewards and bonuses up for grabs!
Chart #2 - Trias (TRIASUSDT) Daily Chart
Chartist: Kyle

Here’s an update on the prior trade we gave on Trias.
I would be looking to compound this long trade on the next higher low (zoom in on the 4-hour chart to better time your entry).
The final take profit level would be at $4.26, which happens to be the 0.618 level from the prior high to current low. I would expect some resistance there.
𝗣𝗿𝗶𝗺𝗲 𝗫𝗕𝗧
Sign up for a new Trading Account on Prime XBT!
Receive a deposit bonus of up to $7,000 with promo code: KyleDoops

Sign up for a new Trading Account on Prime XBT!
Receive a deposit bonus of up to $7,000 with promo code: SheldonSniper
Chart #3 - Bitcoin (BTC/USD) Hourly Chart
Chartist: Kyle

Bitcoin is holding below the prior range low and flipping it from support into now resistance. The key-level is $29,535.
It can be expected that Bitcoin will likely capture the above shown liquidity (as shown by the orange box above the arrows)
The reason we believe its more then likely up first is because the market usually does not give 4 opportunities to short a perfect rejection level.
In this instance its given 4 opportunities. Which outlines this is most likely a short trap and will lead to a short squeeze.
Claim your Bitget sign-up bonuses here (details below).
Chart #4 - Injective (INJ/USDT) Daily Chart
Chartist: Sheldon

Injective Protocol (INJ) is currently trading in the $7.60 - $8.20 area of support.
As price is currently oversold on higher time frames, INJ could be getting ready for another move higher to test the next area of resistance at around $8.85 - $9.25, or even the next major resistance at $10.00 - $10.50.
If the $7.60 area of support is lost, then the next major area of support below, is at around $6.50 - $7.00. There is also a possibility of further downside in the BTC Dominance, and once the price of BTC stabilizes, I see the dominance dropping, resulting in some upside in the General Altcoin Market.
Claim your Bitget sign-up bonuses here (details below).
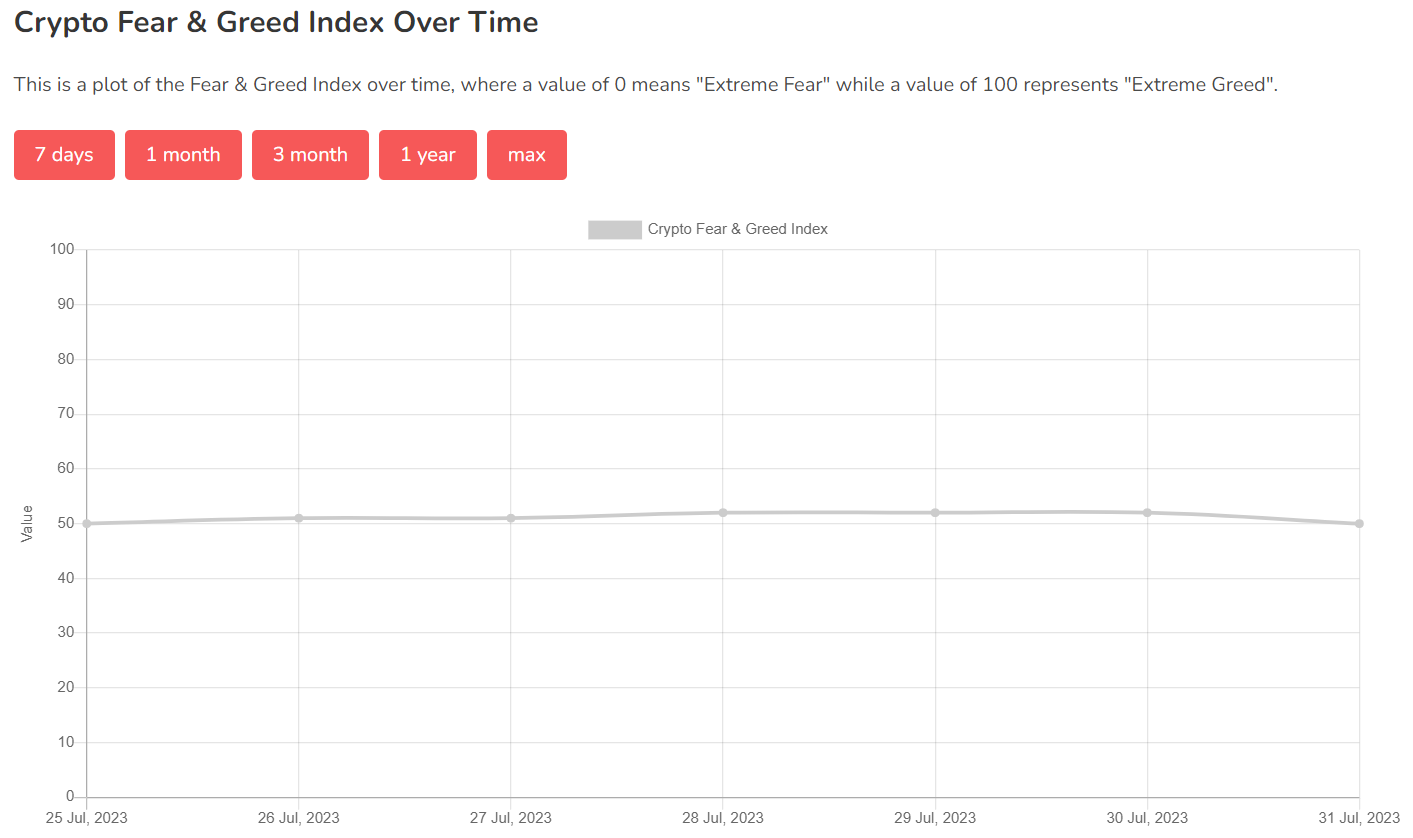
Chart #5 - Fear and Greed Index
The Fear and Greed Index is sitting at 50 today, Neutral.
The highest the index has been over the past seven days is 52, and the lowest is 50.
Banter’s Take
Price is currently consolidating below the LTF range low, but this likely leads to a short squeeze since major liquidity is being built up on the top side.
This probably causes altcoins to pump.
Stay safe my friends!
Go to our Crypto Banter Discord here where Sheldon and Kyle give updates on the charts and trades from The Daily Candle newsletter!