📈📉 Death Cross Alert: ETH's 200 & 50 EMA and the Bearish Outlook!
📈📉 Death Cross Alert: ETH's 200 & 50 EMA and the Bearish Outlook!

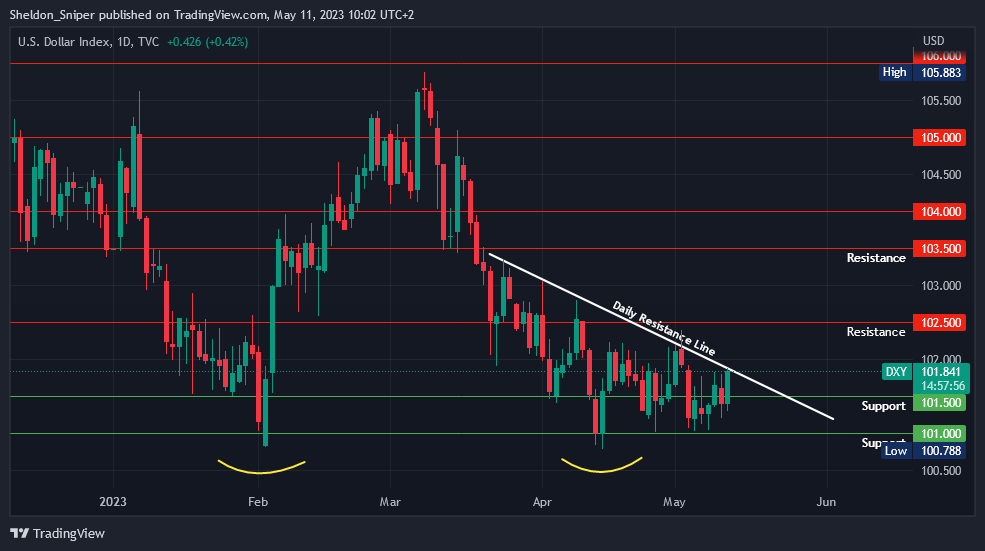
Chart #1 - U.S. Dollar (DXY) 1-Day Chart
Chartist: Sheldon
(For the chart screenshot, click here.)
Following yesterday's favorable US CPI report, the DXY fell significantly from around 101.85 to 101.25. However, today it has returned to its pre-CPI levels and is testing the daily descending resistance line that began in late March.
May is generally not a favorable month for the markets, so the DXY might gain more strength in the next few days, potentially testing the next major resistance level at 102.50. On the downside, the 101.00 - 101.50 range has acted as significant support for the past three and a half months, so I believe it's unlikely to be broken soon.
𝗣𝗿𝗶𝗺𝗲 𝗫𝗕𝗧
Sign up for a new Trading Account on Prime XBT!
Receive a deposit bonus of up to $7,000 with promo code: SheldonSniper
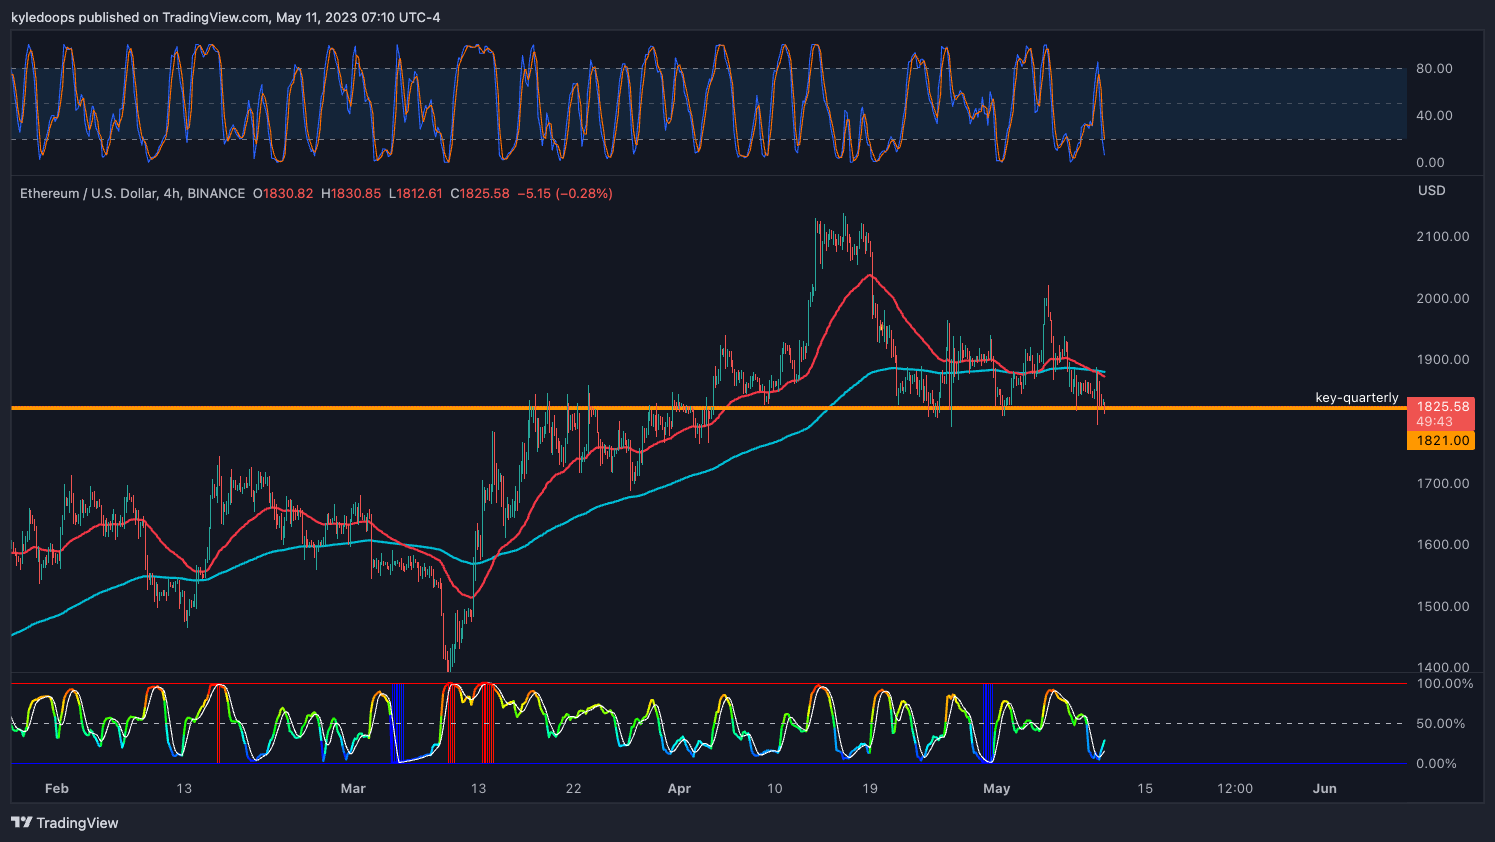
Chart #2 - Ethereum (ETHUSD) 4-Hour Chart
Chartist: Kyle
(For the chart screenshot, click here.)
ETH is currently at a crucial level, which must be maintained to avoid a significant drop. The critical level is $1,821, and if the price falls below that, it would indicate a return to the quarterly range, resulting in lower prices.
Several factors are currently against the bulls, including ETH’s 200 and 50 EMA forming a death cross, which does not support a bullish outlook.
Join us in our Discord for more - find the link at the bottom.
𝗣𝗿𝗶𝗺𝗲 𝗫𝗕𝗧
Sign up for a new Trading Account on Prime XBT!
Receive a deposit bonus of up to $7,000 with promo code: KyleDoops

➡️ ENTER THE COMPETITION HERE ⬅️
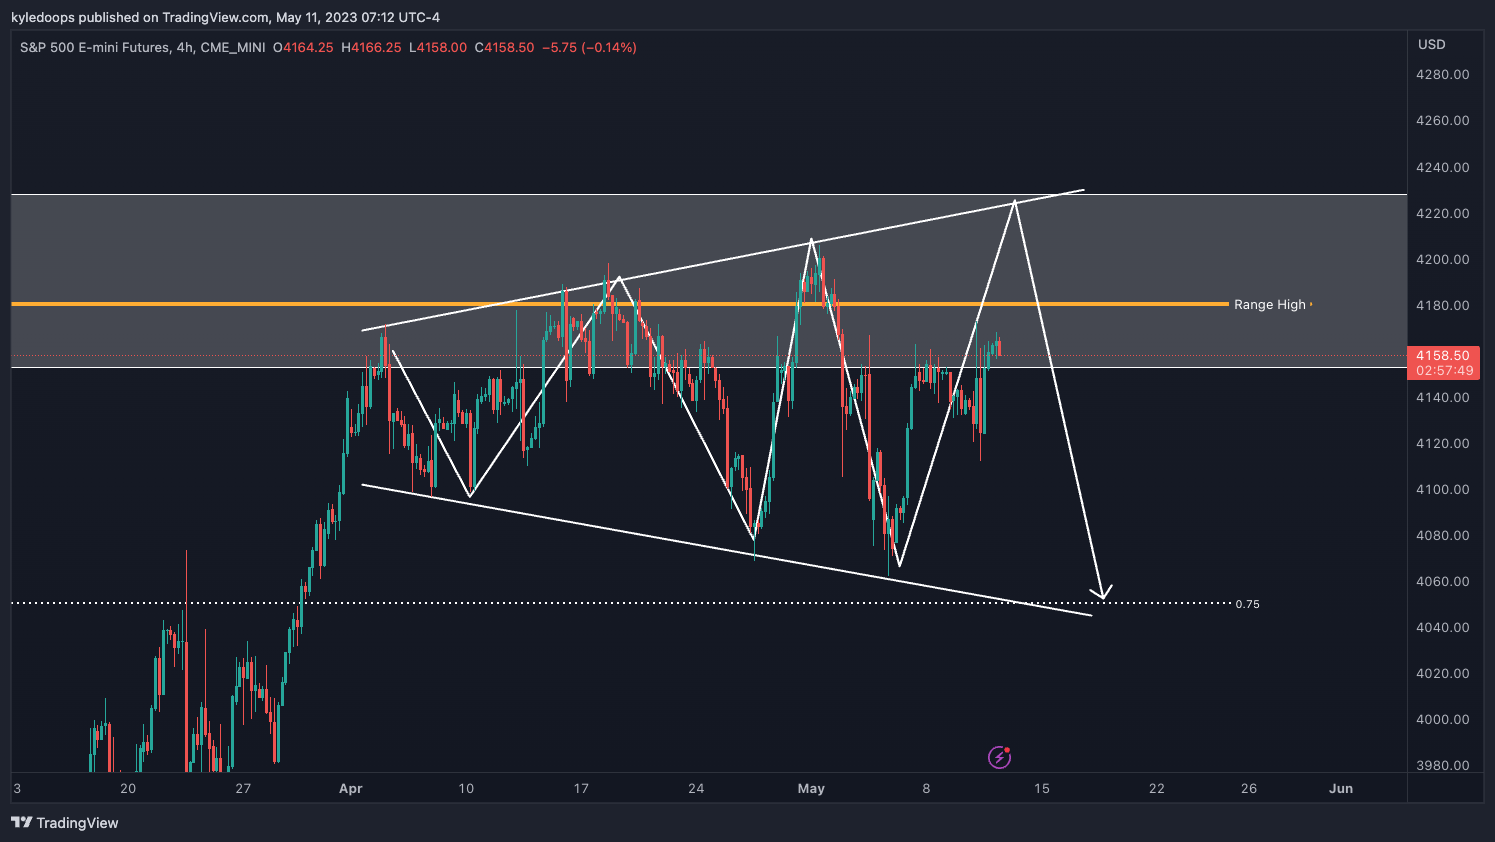
Chart #3 - S&P 500 4-Hour Chart
Chartist: Kyle
(For the chart screenshot, click here.)
The S&P 500 futures chart on the 4-hour timeframe is approaching a resistance zone. The entire grayed-out area represents resistance, with the range high at 4,180, posing a significant challenge for the price to break through.
Currently, prices are retreating, and I suspect the stock market will continue to follow the expanding megaphone pattern seen in my chart above.
Claim your Bitget sign-up bonuses here (details below).
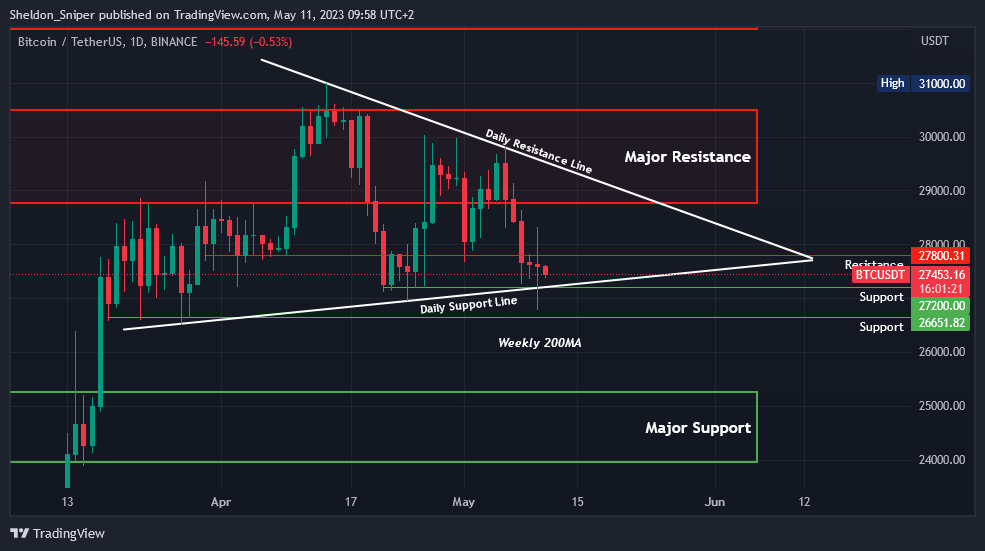
Chart #4 - Bitcoin (BTCUSDT) 1-Day Chart
Chartist: Sheldon
(For the chart screenshot, click here.)
Over the past four days, Bitcoin has fluctuated between $27,200 and $27,800. Despite a positive US CPI report yesterday, the price struggled to break out of this range due to the US Government Bitcoin wallet FUD in the evening.
Since early April, Bitcoin has formed a pennant pattern, currently testing both the pattern's lower boundary and the $27,200 support level. At the moment, Bitcoin appears weak, and if the price breaks below the current support, the next support level is at $26,650. Beyond that, a critical support zone lies between $24,000 and $25,300, where most buyers are waiting to enter the market.
If the price rebounds, the next resistance level is at $27,800, with a significant resistance zone between $28,650 and $30,500, which also aligns with the pennant pattern's upper boundary. May is typically a challenging month for crypto, and market volatility is expected to continue over the next few weeks, potentially leading to a further decline in Bitcoin's price to test lower support levels.
Claim your Bitget sign-up bonuses here (details below).
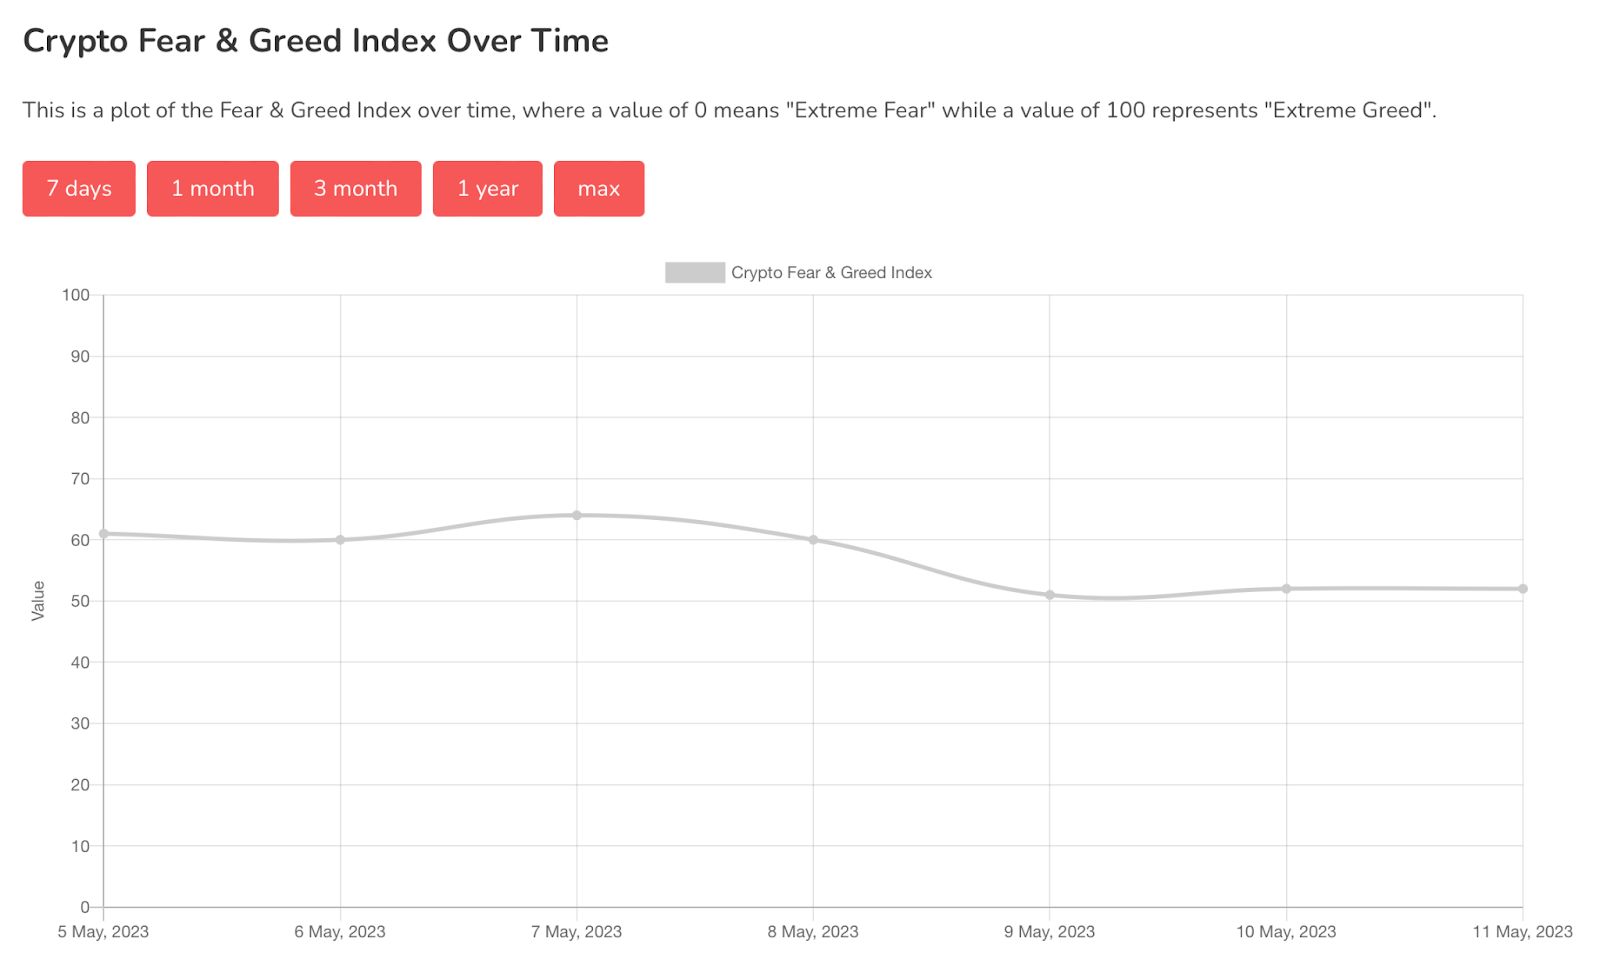
Chart #5 - Bitcoin Fear and Greed Index
The Bitcoin Fear and Greed Index is sitting at 52 today, Neutral.
The highest the index has been over the past seven days is 64, and the lowest is 51.
Banter’s Take
The market has been experiencing wild moves, first to the upside and then it got slammed down. This is typical of a highly illiquid market, and we should expect the trend to continue, with prices moving from liquidity to liquidity.
Stay safe my friends!
Go to our Crypto Banter Discord here where Sheldon and Kyle give updates on the charts and trades from The Daily Candle newsletter!
Today’s winning UIDs:
Bybit winner - 26965836
Bitget winner - 5206205345