

📈📉 Did the bitcoin bears fail? SAND is in the buy zone!
📈📉 Did the bitcoin bears fail? SAND is in the buy zone!

Bitget winner - 8075857485
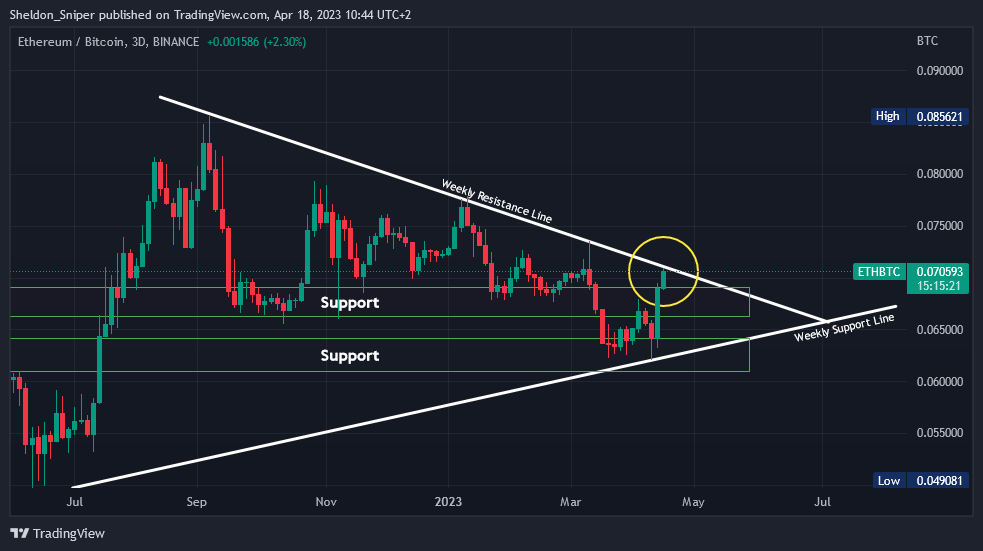
Chart #1 - Ethereum-to-Bitcoin ratio (ETH/BTC) 3-Day Chart
Chartist: Sheldon
(For the chart screenshot, click here.)
The ETH/BTC ratio has risen sharply from 0.064 to just over 0.07, as ETH and a number of altcoins outperform BTC.
The ratio is now at an important weekly descending resistance line that began forming in September. If it breaks through, it is going to be very bullish for alts. A break could take the ratio up to resistance at 0.075 - 0.0775, whereas a rejection would send it back down to the next support at around 0.0675 - 0.07.
𝗣𝗿𝗶𝗺𝗲 𝗫𝗕𝗧
Sign up for a new Trading Account on Prime XBT!
Receive a deposit bonus of up to $7,000 with promo code: SheldonSniper
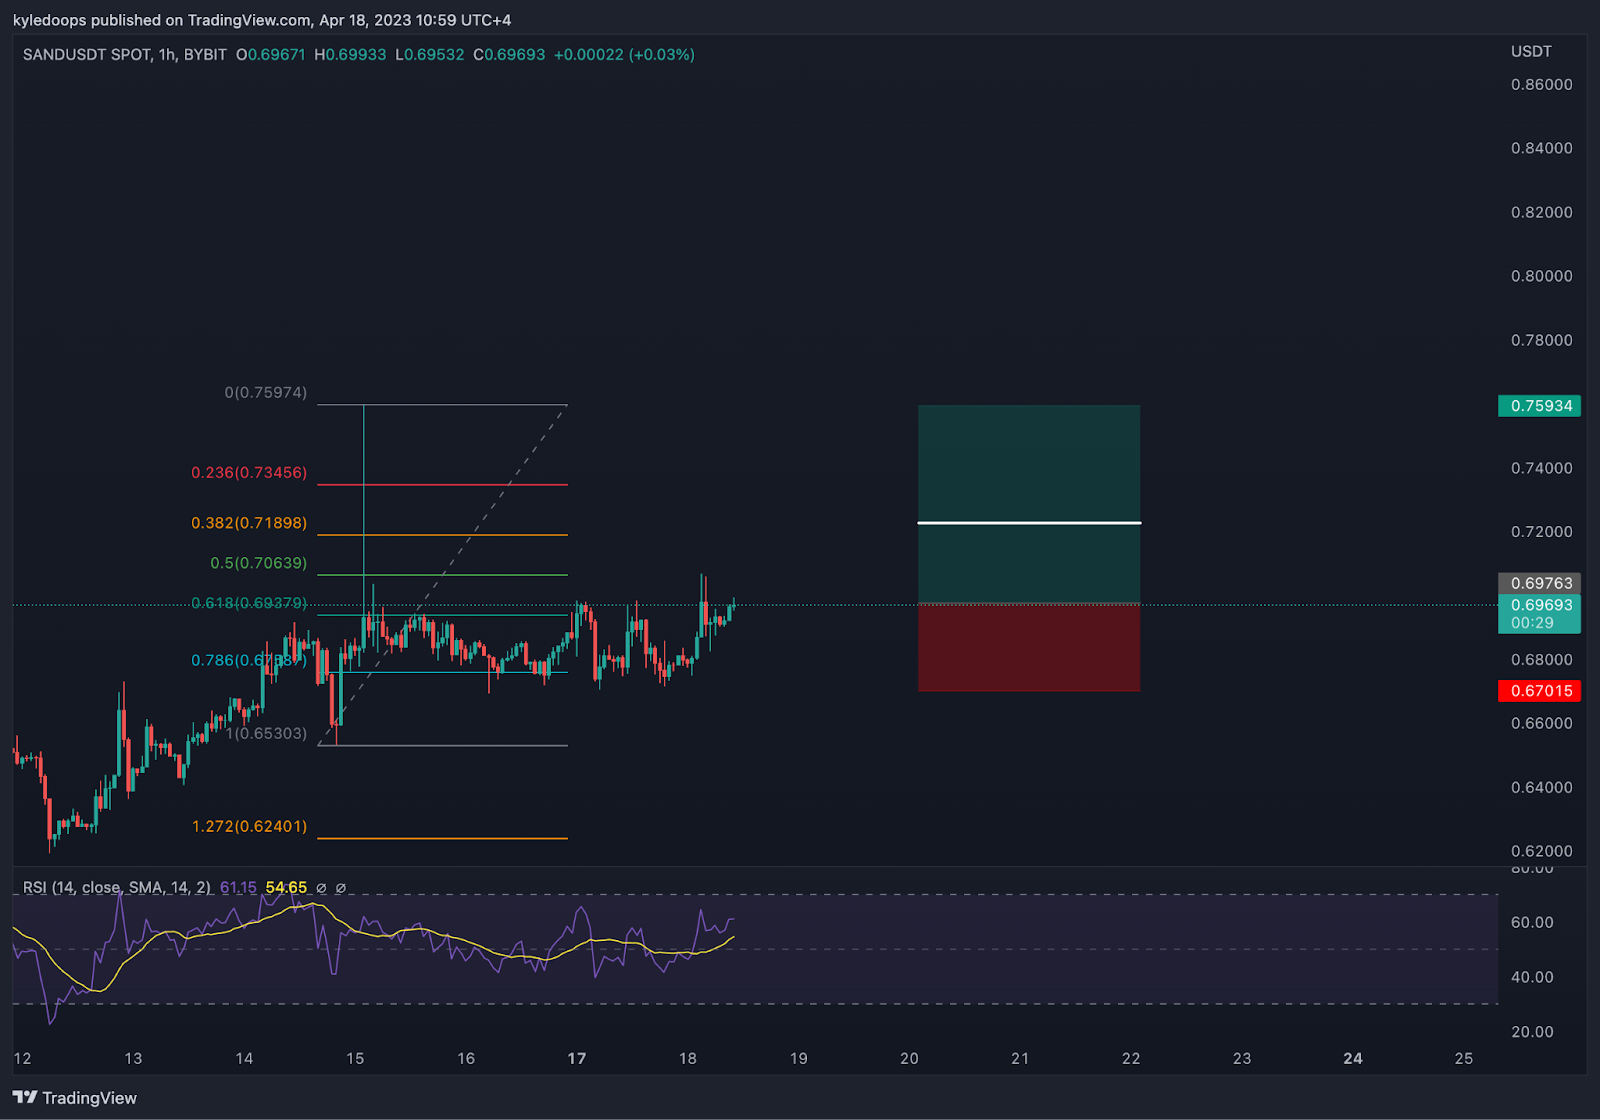
Chart #2 - The Sandbox (SANDUSDT) 1-Hour Chart
Chartist: Kyle
(For the chart screenshot, click here.)
SAND is in the buy zone!
My entry is at $0.69, my stop loss is at $0.67, and my take profit level is at $0.75.
This long trade is based not only on a break of structure from a TA perspective but also based on the fact that other gaming and metaverse tokens have started to take off.
𝗣𝗿𝗶𝗺𝗲 𝗫𝗕𝗧
Sign up for a new Trading Account on Prime XBT!
Receive a deposit bonus of up to $7,000 with promo code: KyleDoops

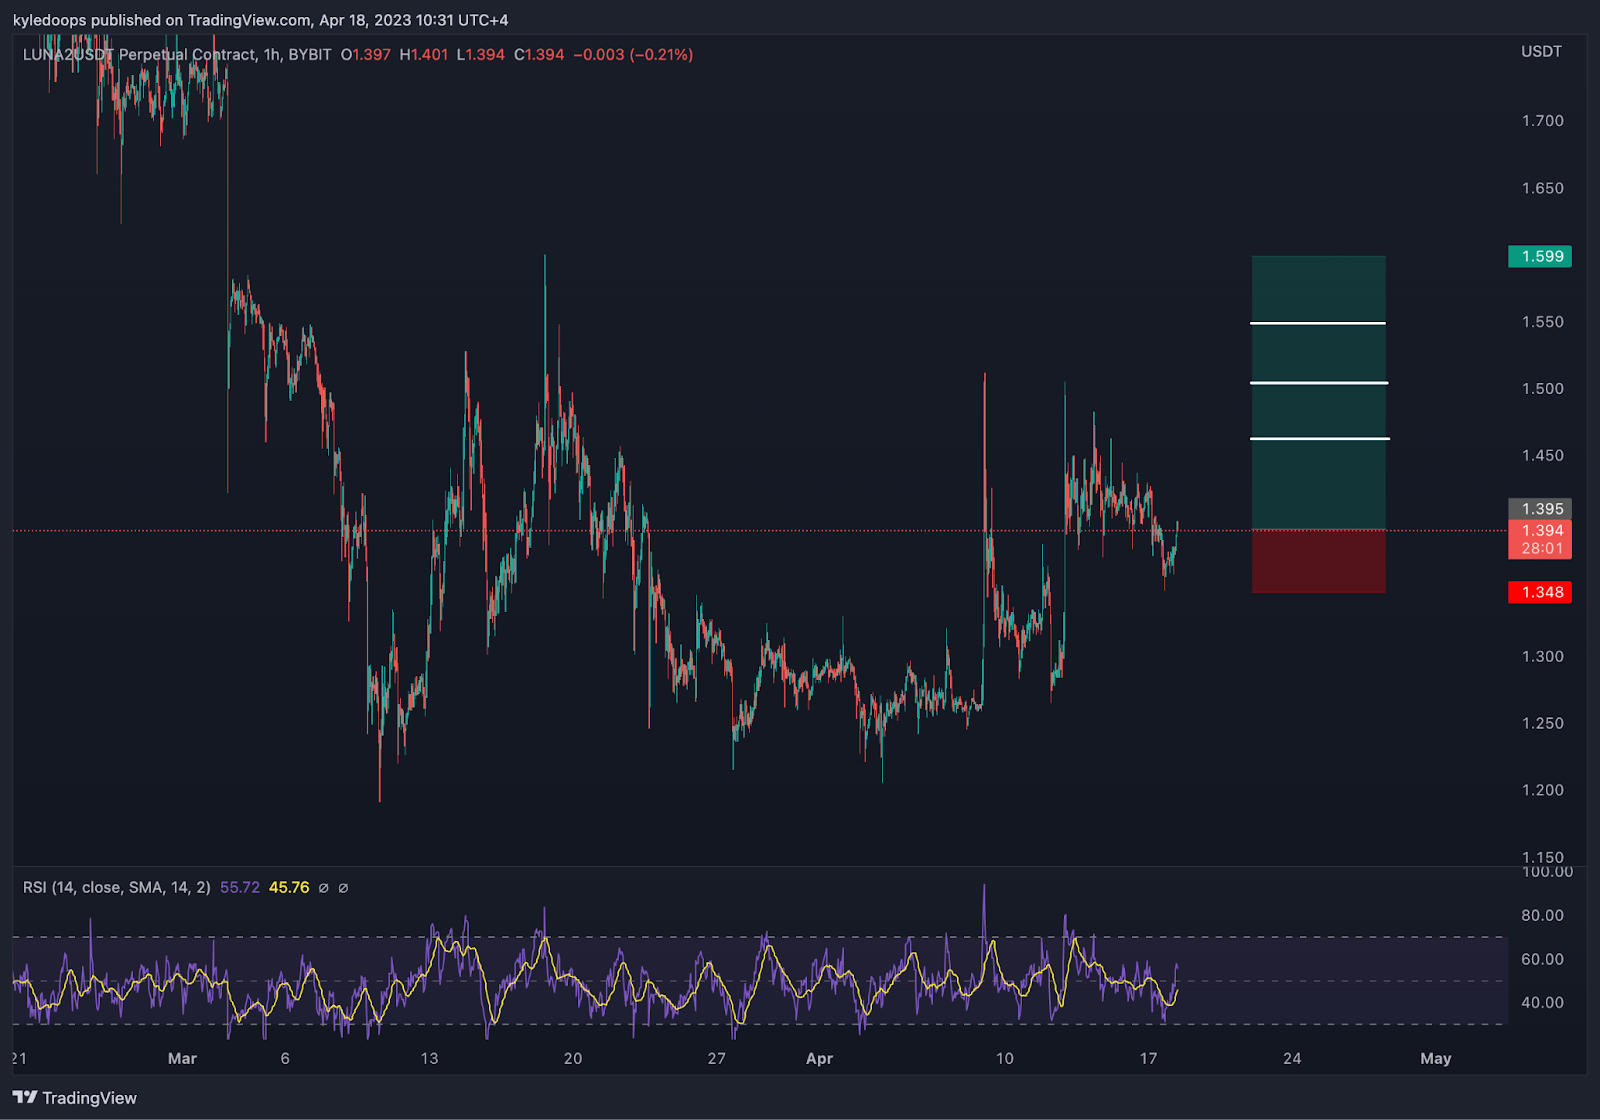
Chart #3 - Terra (LUNAUSDT) 1-Hour Chart
Chartist: Kyle
(For the chart screenshot, click here.)
And here is a long trade on LUNA.
My entry is at $1.39.
My stop loss is set at $1.34.
Lastly, my take profit level is at $1.59.
The coin is in an uptrend on its hourly chart, and I believe this trend will likely continue.
Claim your Bitget sign-up bonuses here (details below).
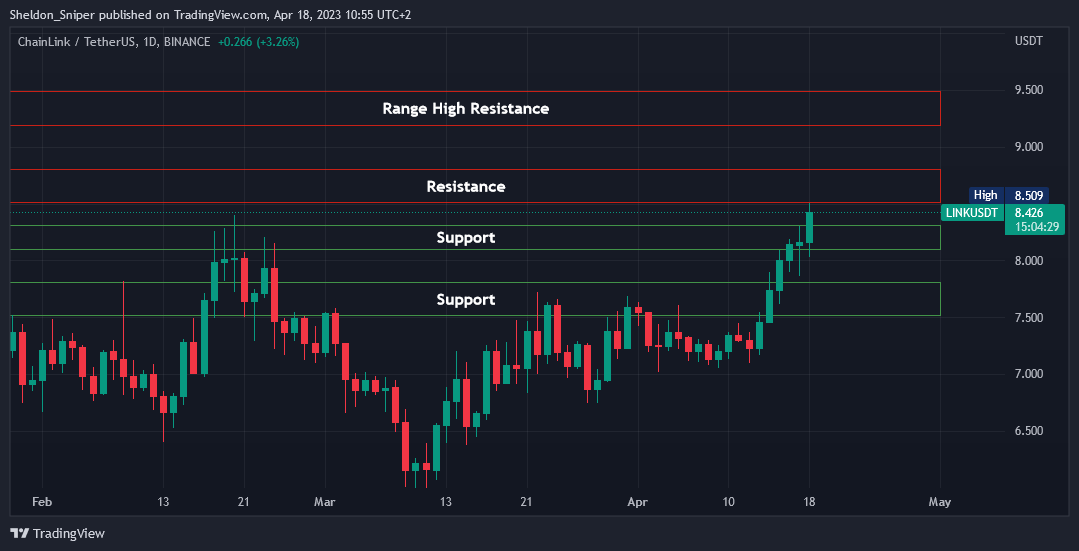
Chart #4 - Chainlink (LINKUSDT) 1-Day Chart
Chartist: Sheldon
(For the chart screenshot, click here.)
This morning LINK broke through its $8.25 resistance, which will now be acting as support, and the price has moved up to the $8.50 - $8.75 resistance zone.
There is a chance LINK retests $8.10 - $8.25, which will give us an opportunity to go long (if BTC cooperates).
A breach of the $8.50 - $8.75 resistance could take it up to test its range-high resistance at $9.30 - $9.50.
Claim your Bitget sign-up bonuses here (details below).
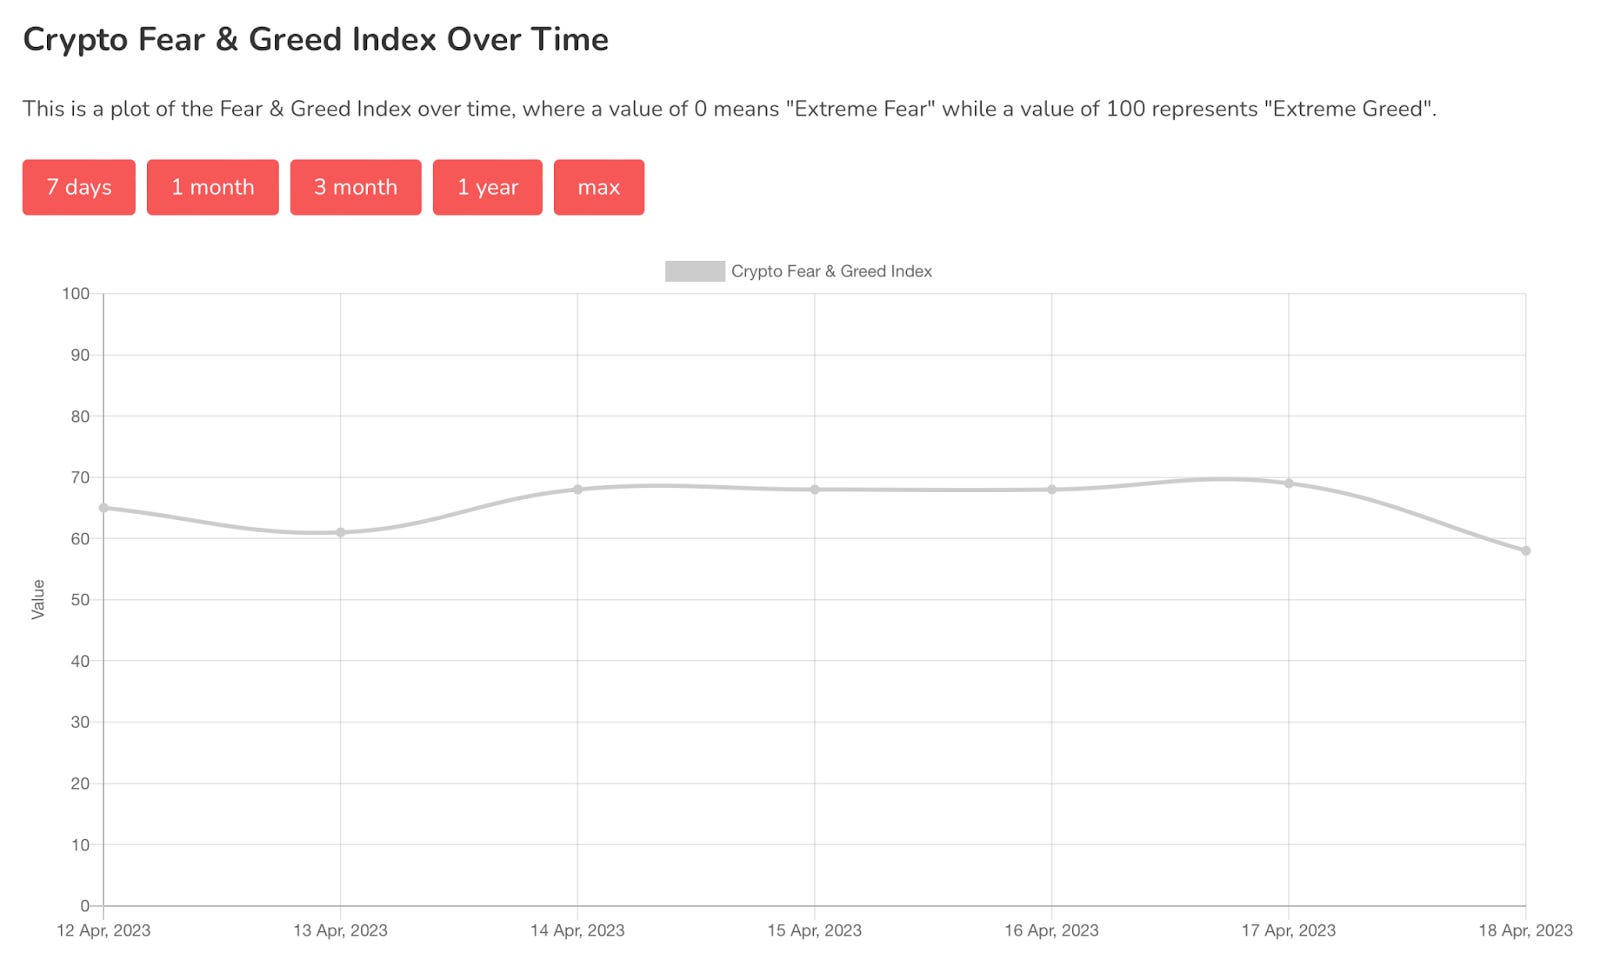
Chart #5 - Bitcoin Fear and Greed Index
The Bitcoin Fear and Greed Index is sitting at 58 today, indicating Greed.
The highest the index has been over the past seven days is 69, and the lowest is 58.
Banter’s Take
The entire market is bouncing.
Bitcoin may be in the process of confirming a swing failure pattern, meaning that bears failed their attempt to send it lower. If bitcoin reclaims and holds above $30,000, it would be incredibly bullish for the entire market.
Stay safe my friends!
Go to our Crypto Banter Discord here where Sheldon and Kyle give updates on the charts and trades from The Daily Candle newsletter!
Bybit winner - 7993109