

📈📉 Do-or-die level for ETH that could crash alts! Fantom to $.30?
📈📉 Do-or-die level for ETH that could crash alts! Fantom to $.30?

Bitget winner - 8404188313
Chart #1 - Fantom (FTMUSDT) 12-Hour Chart
Chartist: Sheldon

(For the chart screenshot, click here.)
Yesterday, the CFTC charged Binance and, as a result, the crypto market responded badly, including FTM, which retraced to $0.40 (support).
Its key indicators are oversold and it's retesting the previous daily resistance line as support, so it may bounce (subject to what bitcoin does) and test resistance at $0.45, or possibly even $0.50. But if FTM loses its current support, it could head to its major support region between $0.30 -$0.34.
The last three months have seen most cash flow into bitcoin, but I suspect that might soon change with cash flowing into alts.
𝗣𝗿𝗶𝗺𝗲 𝗫𝗕𝗧
Sign up for a new Trading Account on Prime XBT!
Receive a deposit bonus of up to $7,000 with promo code: SheldonSniper
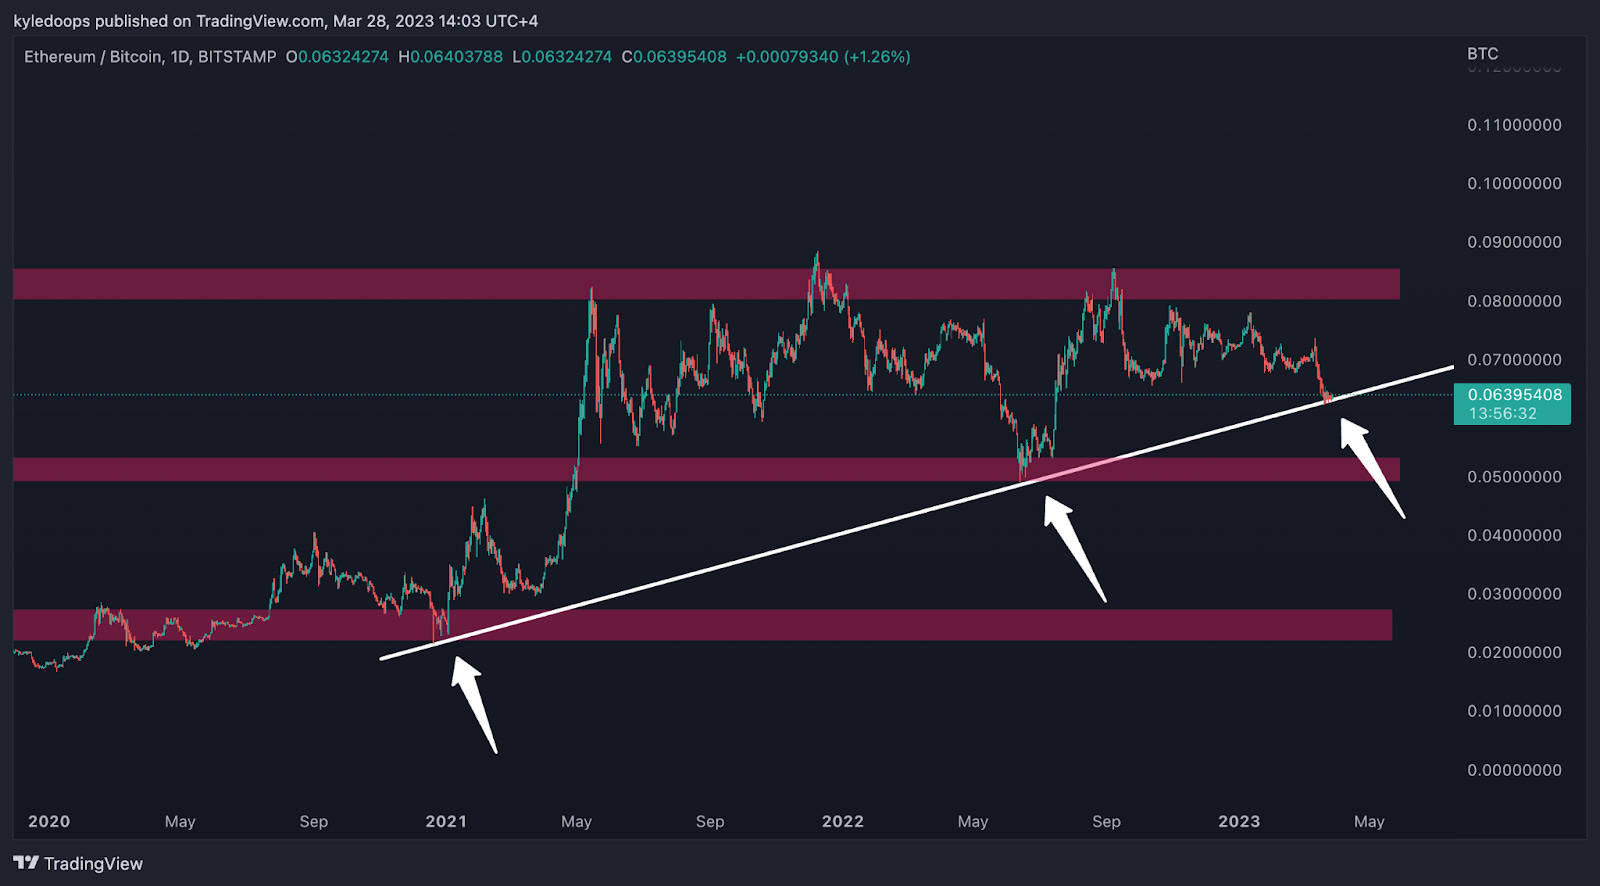
Chart #2 - Ethereum/Bitcoin (ETHBTC) 1-Day Chart
Chartist: Kyle
(For the chart screenshot, click here.)
The ETH/BTC chart is showing minor signs of life as it seems to be holding and respecting its diagonal trend line. So long as the line continues to hold up, alts have a chance of bouncing against their bitcoin pairs.
If, however, the level is lost, alts could fall another 20% against bitcoin.
So basically, this is a do-or-die level for ETH, and it must hold up against bitcoin.
𝗣𝗿𝗶𝗺𝗲 𝗫𝗕𝗧
Sign up for a new Trading Account on Prime XBT!
Receive a deposit bonus of up to $7,000 with promo code: KyleDoops

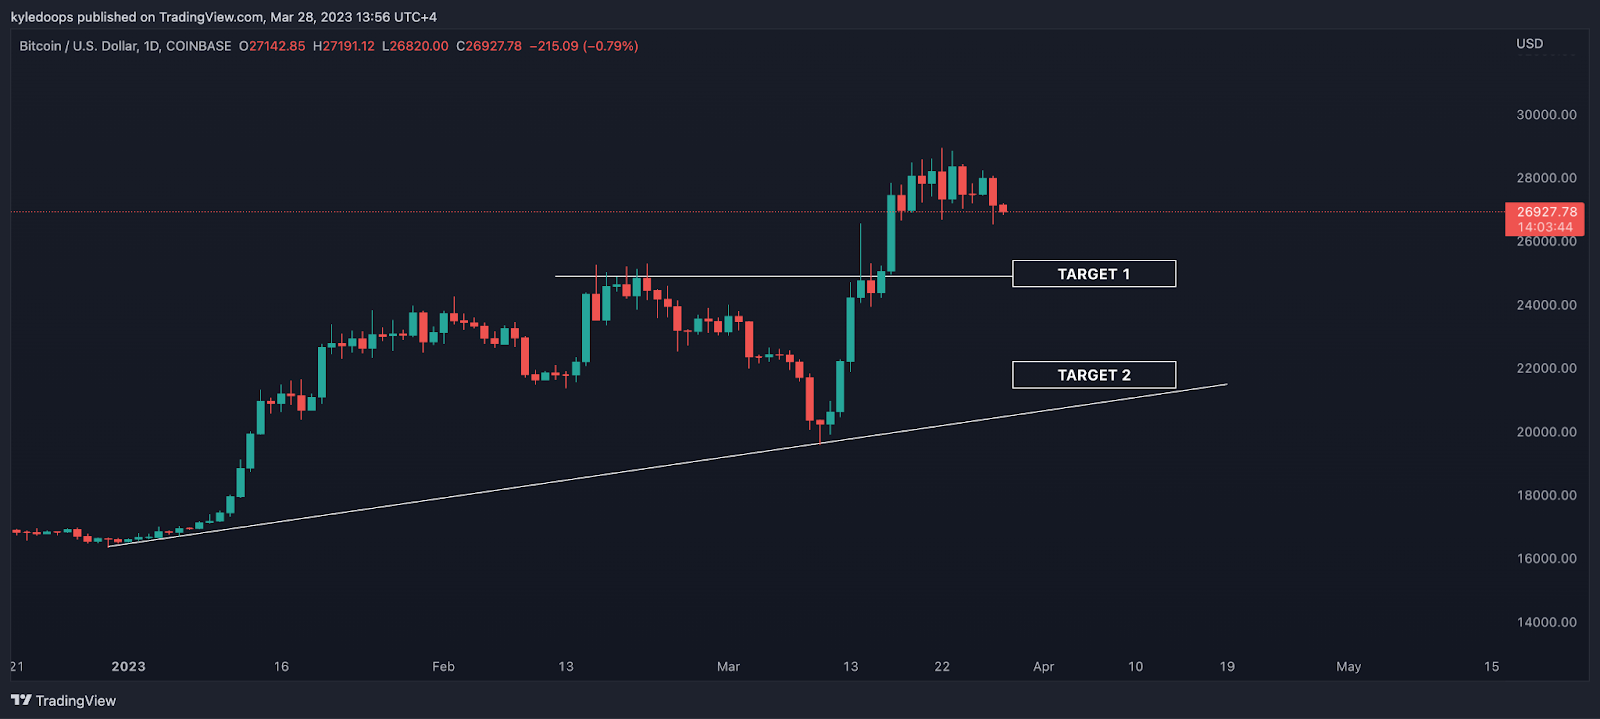
Chart #3 - Bitcoin (BTCUSD) 1-Day Chart
Chartist: Kyle
(For the chart screenshot, click here.)
I see two bitcoin targets in sight as it shows signs of distribution.
I'd be looking at $25,000 as the first area of major support, which happened to be the prior range high. This area should at the very least provide a decent bounce.
Failure to hold that level would mean BTC retraces to target 2, which is at $22,000. That is the final area I would buy at. If bitcoin starts to lose that level, things become incredibly bearish very quickly.
Claim your Bitget sign-up bonuses here (details below).
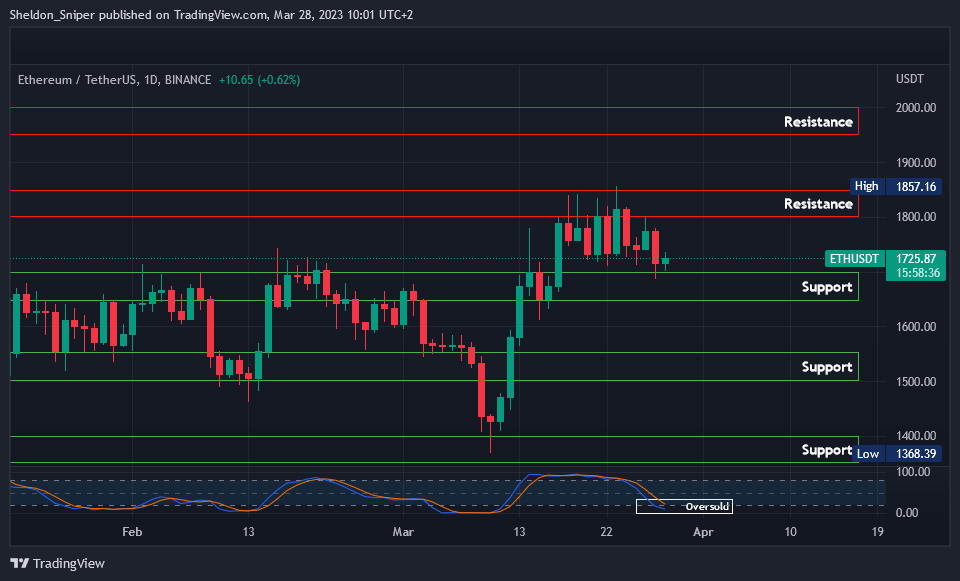
Chart #4 - Ethereum (ETHUSDT) 1-Day Chart
Chartist: Sheldon
(For the chart screenshot, click here.)
ETH needs to hold support at $1,680 - $1,700 in order to test its higher resistance levels.
It's looking like it might be possible because its indicators on the higher time frames are oversold, so we may see it reach $1,800 - $1,850, with a chance of it breaking through there, and reaching $2,000. But if it decides to drop, it could reach $1,600 or the next critical support level between $1,500 - $1,550.
If it holds strong, combined with Kyle’s ETH/BTC analysis, we could see a trend reversal with money flowing from BTC to ETH and other major alts.
Claim your Bitget sign-up bonuses here (details below).
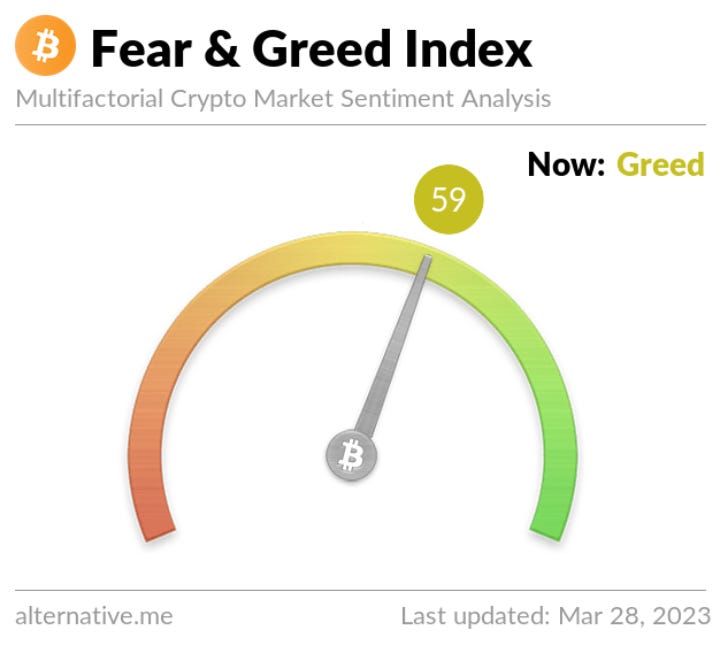
Chart #5 - Bitcoin Fear and Greed Index
The Bitcoin Fear and Greed Index is sitting at 59 today, indicating Greed.
The highest the index has been over the past seven days is 64, and the lowest is 57.
Overall Market Sentiment (Banter’s Take)
Yesterday's market sell-off caught many by surprise, but thankfully The Daily Candle readers were forewarned of a potential price drop, signaled by the developing diamond top pattern.
We are now on higher-low watch, looking to buy into the next major support levels.
Stay safe my friends!
Go to our Crypto Banter Discord here where Sheldon and Kyle give updates on the charts and trades from The Daily Candle newsletter!
Bybit winner - 58493816