

📈📉 Don't Miss This +150% MOONSHOT Trade!
📈📉 Don't Miss This +150% MOONSHOT Trade!
A 30-40% Flash Dip Could Be INCOMING!
Overview
Chart #1 - Polygon (MATICUSDT) 8-Hour
Chart #2 - Illuvium (ILVUSDT) 8-Hour
Chart #3 - Filecoin (FILUSDT) 4-Hour
Chart #4 - Kaspa Network (KASUSDT) 8-Hour
Chart #5 - Fear and Greed Index
Chart #1 - Polygon (MATICUSDT) 8-Hour
Chartist: Sheldon

(For the chart screenshot, click here.)
Some Layer 2 coins have been performing very well over the last few weeks. MATIC has not had a proper break out yet, and price is trading in an area of resistance.
Once we get the break, I’ll go long to the next area of resistance.
Entry: I will enter into a long spot position at the break of the upper resistance level of $1.25.
TP: Take profit is at the next area of resistance, which is between $1.50 - $1.60 (20% - 28%)
Stop Loss: Just below $1.20
Sign-up and trade on Bybit today.
Exclusive $30,000 deposit rewards and bonuses up for grabs!
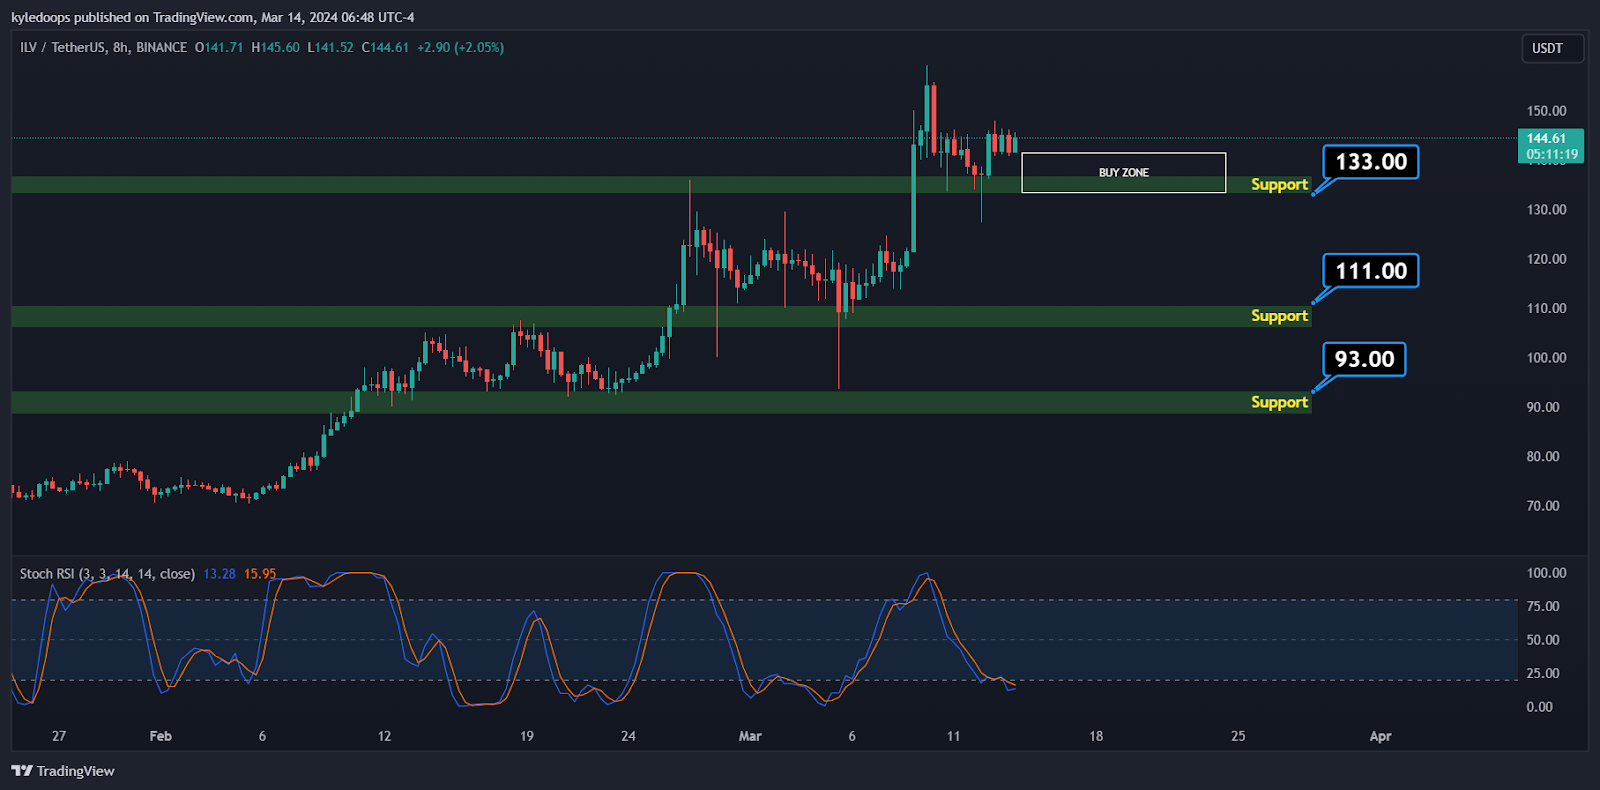
Chart #2 - Illuvium (ILVUSDT) 8-Hour
Chartist: Kyle
(For the chart screenshot, click here.)
ILV remains bullish and is currently within an area of interest, in which we can add to our position on spot.
Entry: $130 to $150
TP1: $170
TP2: $266
Stop Loss: Bellow $127
Claim your Bitget sign-up bonuses here (details below).

Outsmart 99% Of The Market!
Get full access into our Discord And Telegram group, where you'll find all of our premium content!
👉 Trade Signals!
👉 Trade Set-Ups!
👉 Trading Challenges!
👉 Education!
👉 SO MUCH MORE!
Chart #3 - Filecoin (FILUSDT) 4-Hour
Chartist: Kyle

(For the chart screenshot, click here.)
FIL continues its bullish momentum!
It broke resistance and is retesting it as support at $10. Holding support here will open up its range towards $16.5 and beyond.
We’ll look for a change of character for confirmation to enter.
Entry: $10 to $11
TP1: $13
TP2: $16.5
TP3: $25 (Moonshot Target)
Stop Loss: Loosing $9.50
Claim your Bitget sign-up bonuses here (details below).
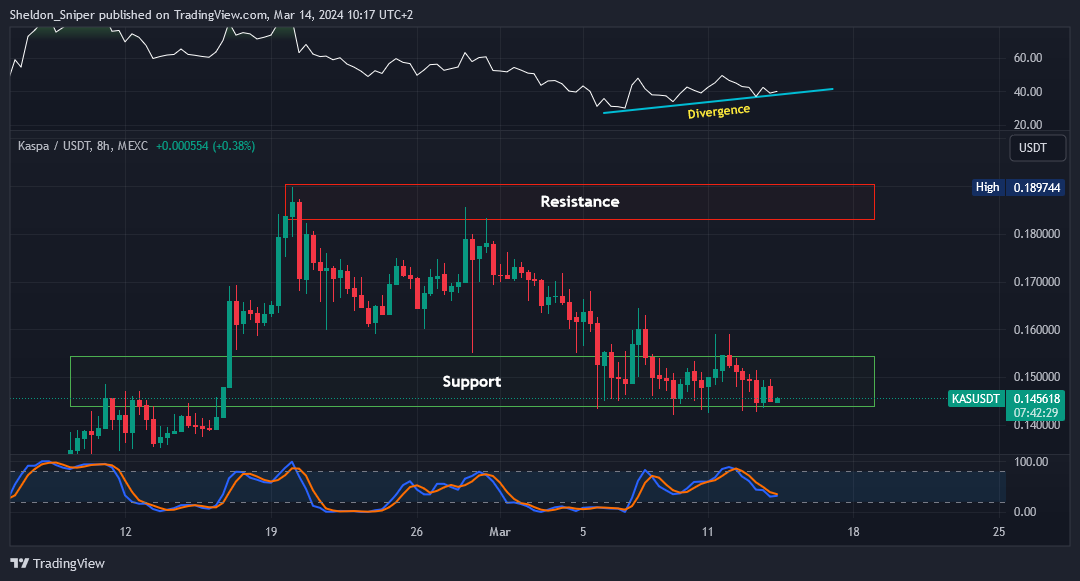
Chart #4 - Kaspa Network (KASUSDT) 8-Hour
Chartist: Sheldon
(For the chart screenshot, click here.)
KAS has been consolidating in an area of support for almost two weeks. We are starting to see a bullish divergence on the 8HR time frame, which could indicate that price is getting ready to move higher.
Entry: At the current support level of $0.14
TP: We’ll sell 25% at the top of the range at $0.155. If that level is broken, we’ll let the balance ride up to the next area of resistance at $0.1825 - $0.19. (30% - 36%)
Stop Loss: Just below $0.145
Claim your Bitget sign-up bonuses here (details below).
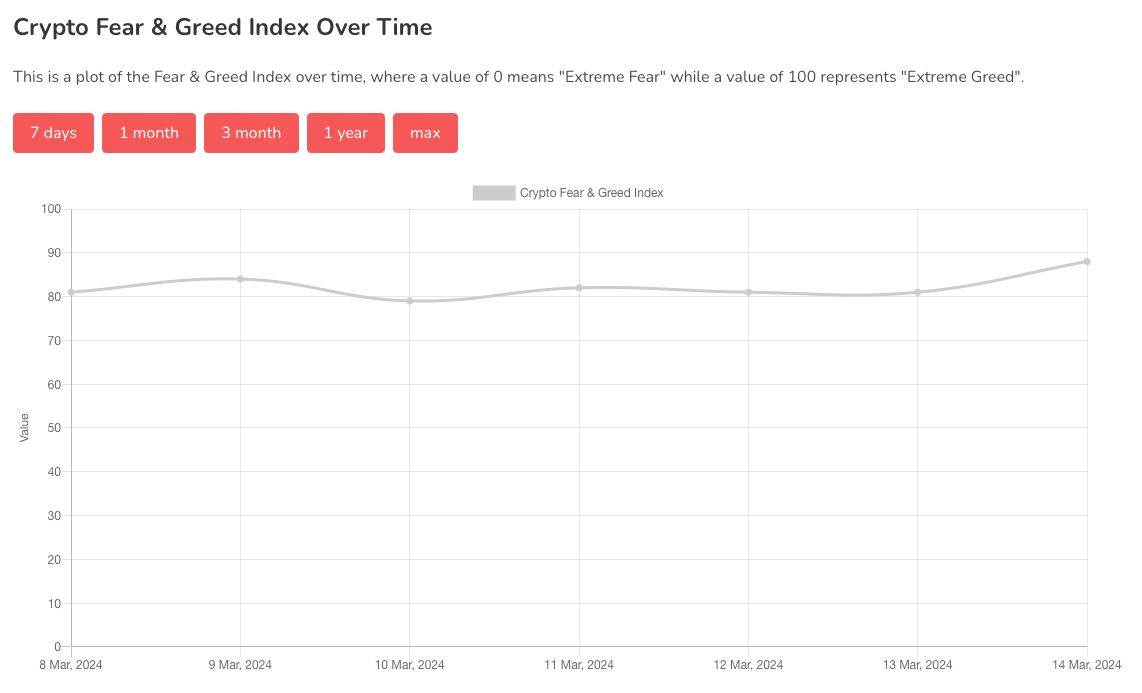
Chart #5 - Fear and Greed Index
The Fear and Greed Index is sitting at 88 today, indicating Extreme Greed.
The highest the index has been over the past seven days is 88, and the lowest is 79.
Banter’s Take
BTC and ETH on high time frames are still looking very strong. As we ride higher, we can treat the previous weekly levels as key support areas to hold and look to cut positions if those areas are lost.
For BTC this level is at $63k and on ETH at $3,400. If we begin getting weekly closes below these areas it could signal further downside potential. This said, a 30% to 40% fast correction in BTC price is still on the cards so prepare your portfolios accordingly and always make sure you have dry powder available to buy the dips.
Stay safe my friends!
Go to our Crypto Banter Discord here where Sheldon and Kyle give updates on the charts and trades from The Daily Candle newsletter!