

📈📉Don't Miss THIS +260% Altcoin Trade!
📈📉Don't Miss THIS +260% Altcoin Trade!
PLUS: BTC All-Time High TODAY?
Overview
Chart #1 - Paribus (PBXUSDT) 8-Hour
Chart #2 - The Graph (GRTUSDT) 4-Hour
Chart #3 - Kaspa (KASUSDT) 8-Hour
Chart #4 - Ethereum (ETHUSDT) 3-Day
Chart #5 - Fear and Greed Index
Chart #1 - Paribus (PBXUSDT) 8-Hour
Chartist: Sheldon
(For the chart screenshot, click here.)
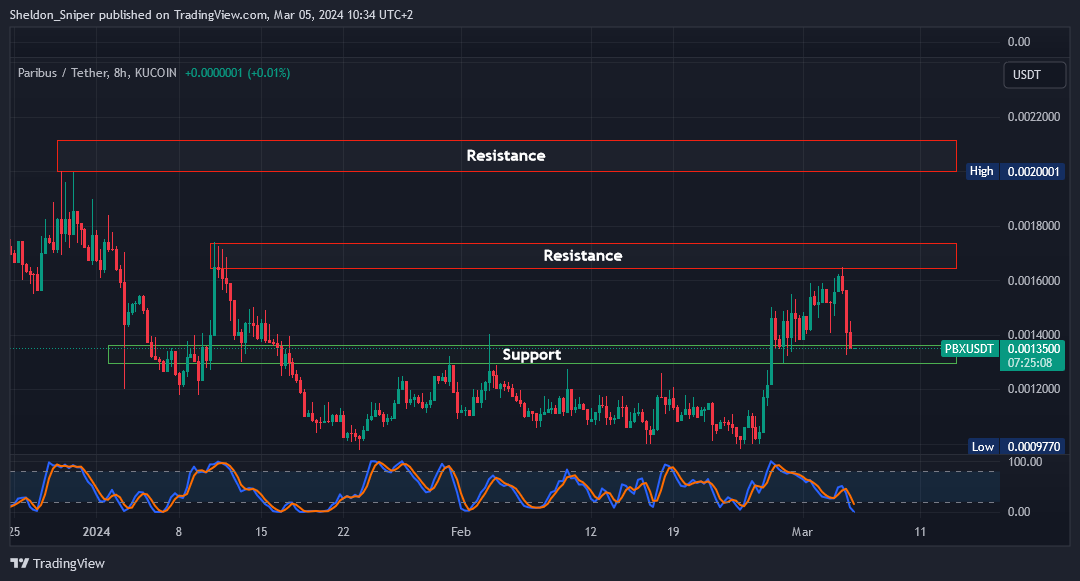
PBX is trading in an area of support. And we can trade it!
This trade is high risk, so I’ll use only a small amount of capital, with a tight stop loss. No leverage!
Entry: Enter in the $0.0013 - $0.00136 area of support.
Take Profit (TP): Take profit at the next areas of resistance
TP1: $0.00165 - $0.00174
TP2: $0.002 - $0.00212
Stop Loss: A tight stop loss at just below $0.001275
Sign-up and trade on Bybit today.
Exclusive $30,000 deposit rewards and bonuses up for grabs!
Chart #2 - The Graph (GRTUSDT) 4-Hour
Chartist: Kyle
(For the chart screenshot, click here.)
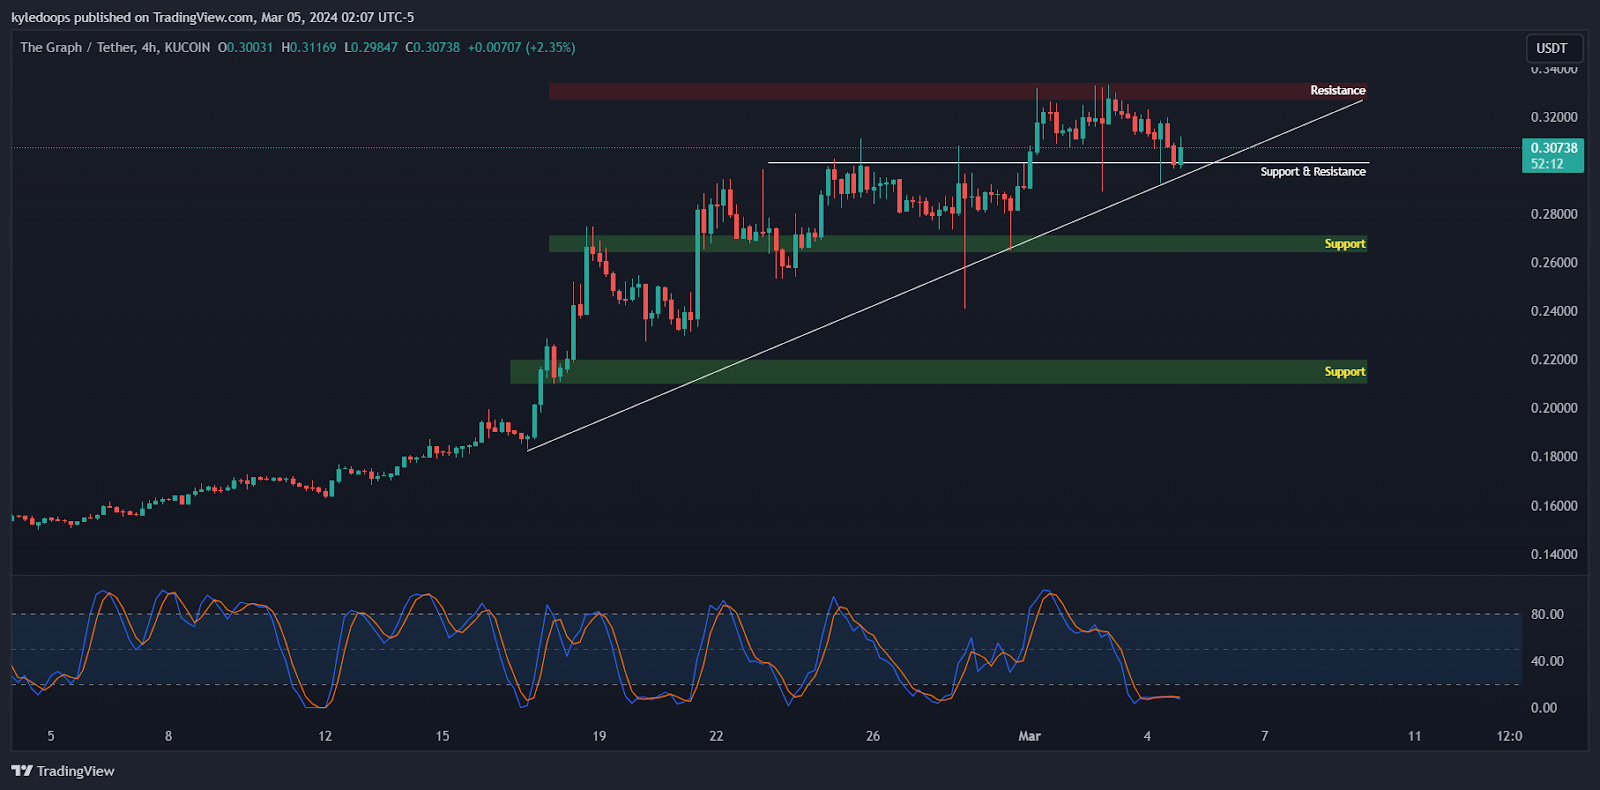
GRT is showing a bullish continuation pattern and pushing up into a important resistance area here at $0.32.
Flipping this level into support will open new ranges. With the 4HR and daily Stochastic RSI’s reset we can look for higher TP areas as price moves into a new range.
Clear invalidation would be losing the $0.26 support as this will confirm deviation back into the lower ranges.
Phase 1
Entry: $0.29 to $0.31
Stoploss: Under $0.26
Phase 2:
Entry: On Flip of 0.32 into support
Stop Loss: Under $0.29
Take Profit (TP) targets for price on a long-term trade:
$0.55
$0.76
$1.1 (that’s a +260% gain)
Claim your Bitget sign-up bonuses here (details below).

Outsmart 99% Of The Market!
Get full access into our Discord And Telegram group, where you'll find all of our premium content!
👉 Trade Signals!
👉 Trade Set-Ups!
👉 Trading Challenges!
👉 Education!
👉 SO MUCH MORE!
Chart #3 - Kaspa (KASUSDT) 8-Hour
Chartist: Kyle

(For the chart screenshot, click here.)
KAS is holding support above $0.16. If it holds on the retest, we can expect higher levels to come!
Entry 1: Between $0.14 and $0.17
Stop Loss: Under $0.135
Entry 2: Look for the flip of $0.18 into support to add to the trade.
Take Profits (TPs):
TP1: $0.25
TP2: $0.5
TP3: We’ll leave some for higher levels.
Claim your Bitget sign-up bonuses here (details below).
Chart #4 - Ethereum (ETHUSDT) 3-Day
Chartist: Sheldon
(For the chart screenshot, click here.)
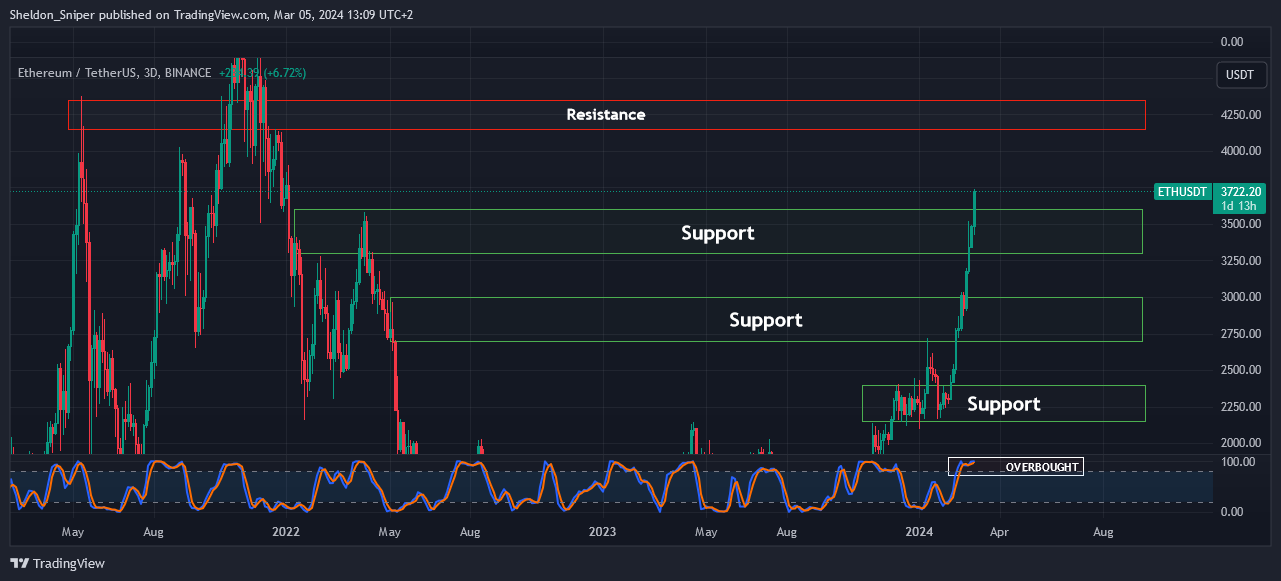
ETH is trading at around $3,685, just above the $3,250 - $3,600 area of support.
This morning BTC surged, so there could be a small pullback in the market that will give us the opportunity to get into ETH at a lower price.
Entry: Ladder into a spot trade at around the $3,250 level of support.
Take Profits (TP): Anywhere around $4,150 - $4,350.
Stop Loss: Just below $3,000.
Claim your Bitget sign-up bonuses here (details below).
Chart #5 - Fear and Greed Index
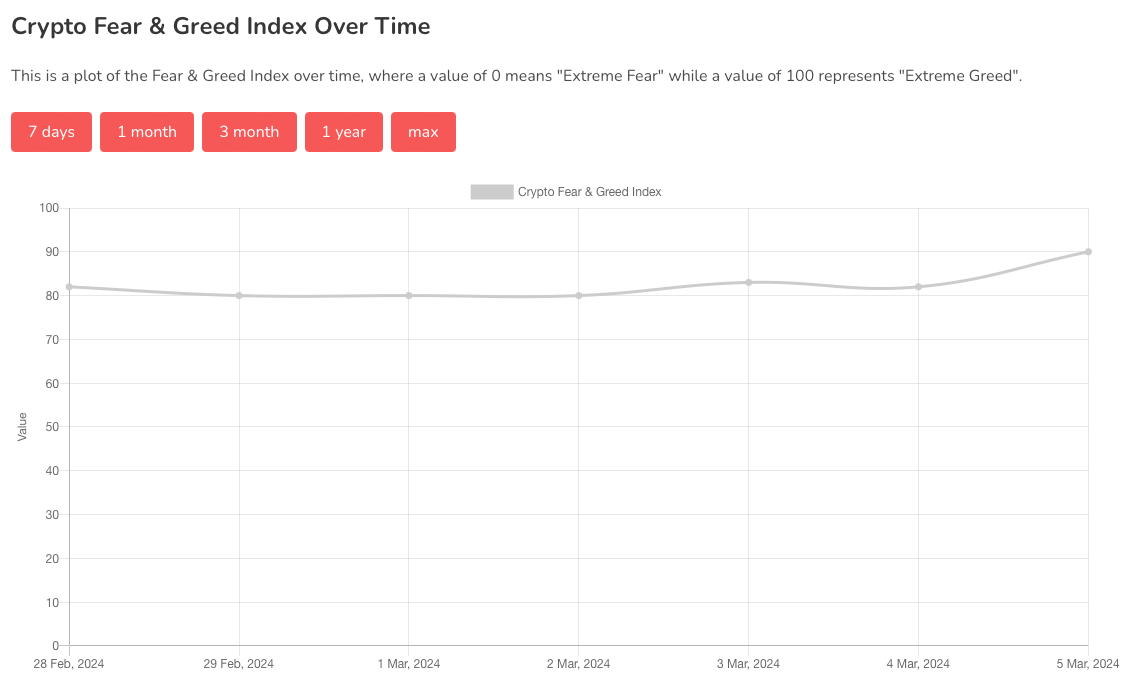
The Fear and Greed Index is sitting at 90 today, indicating Extreme Greed.
The highest the index has been over the past seven days is 90, and the lowest is 80.
Banter’s Take
Bitcoin continues to push for higher levels, and we could be looking at all-time highs as early as later today!
The total market cap still shows a potential move of up to 20% further to the upside, lending liquidity to ETH and the other major altcoins when we have a breakdown in BTC dominance.
We continue to monitor the markets for any higher lows to add onto positions. Sell orders continue to get liquidated as we move higher, adding fuel to the fire as free liquidity is up for the taking. With this in mind, we remain vigilant and manage our risk correctly in any open positions. Remember, the trend is your friend only until it bends; we’ll manage our trades from range to range.
Stay safe my friends!
Go to our Crypto Banter Discord here where Sheldon and Kyle give updates on the charts and trades from The Daily Candle newsletter!