

📈📉 DXY at MAJOR Resistance! + Massive COIN Opportunity!
📈📉 DXY at MAJOR Resistance! + Massive COIN Opportunity!
Overview
Chart #1 - Bitcoin (BTCUSDT) Daily Chart
Chart #2 - S&P 500 (ES1!) Daily Chart
Chart #3 - Coinbase (COIN) Weekly Chart
Chart #4 - U.S. Dollar (DXY) Daily Chart
Chart #5 - Fear and Greed Index

Chart #1 - Bitcoin (BTCUSDT) Daily Chart
Chartist: Sheldon
(For the chart screenshot, click here.)
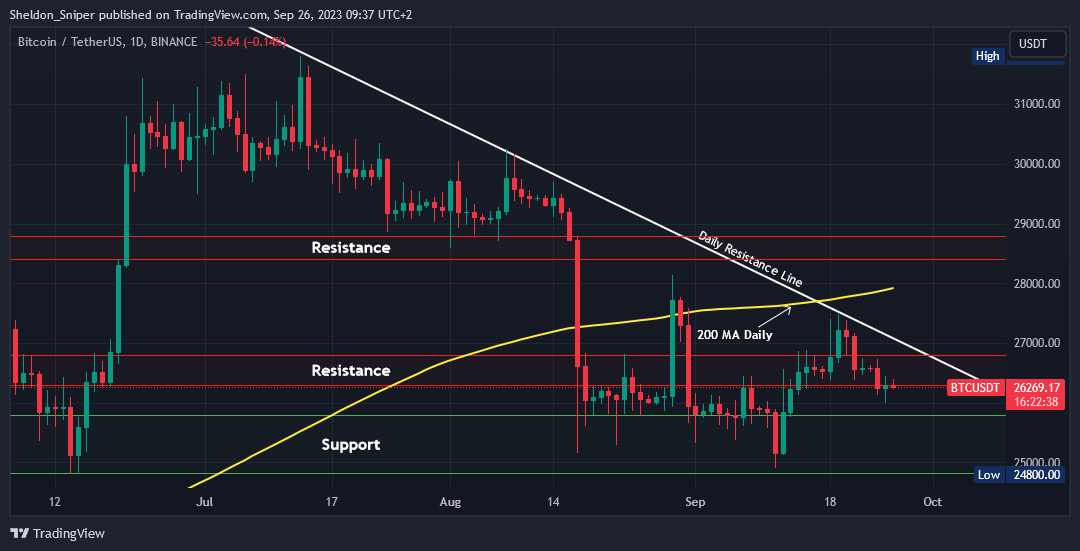
Last Tuesday, the price of BTC was rejected at the daily descending resistance line from July, around $27,500.
Since then, the price has retraced to $26,000 and is currently testing the $26,300 resistance level. A rejection at this level could potentially send BTC down to the next support level at $25,800 or even lower to the bottom of the range at $24,800.
If the $26,300 resistance level is breached again, the next resistance is at $26,600, or even the daily descending resistance line at $27,000.
Sign-up and trade on Bybit today.
Exclusive $30,000 deposit rewards and bonuses up for grabs!
Chart #2 - S&P 500 (ES1!) Daily Chart
Chartist: Kyle
(For the chart screenshot, click here.)
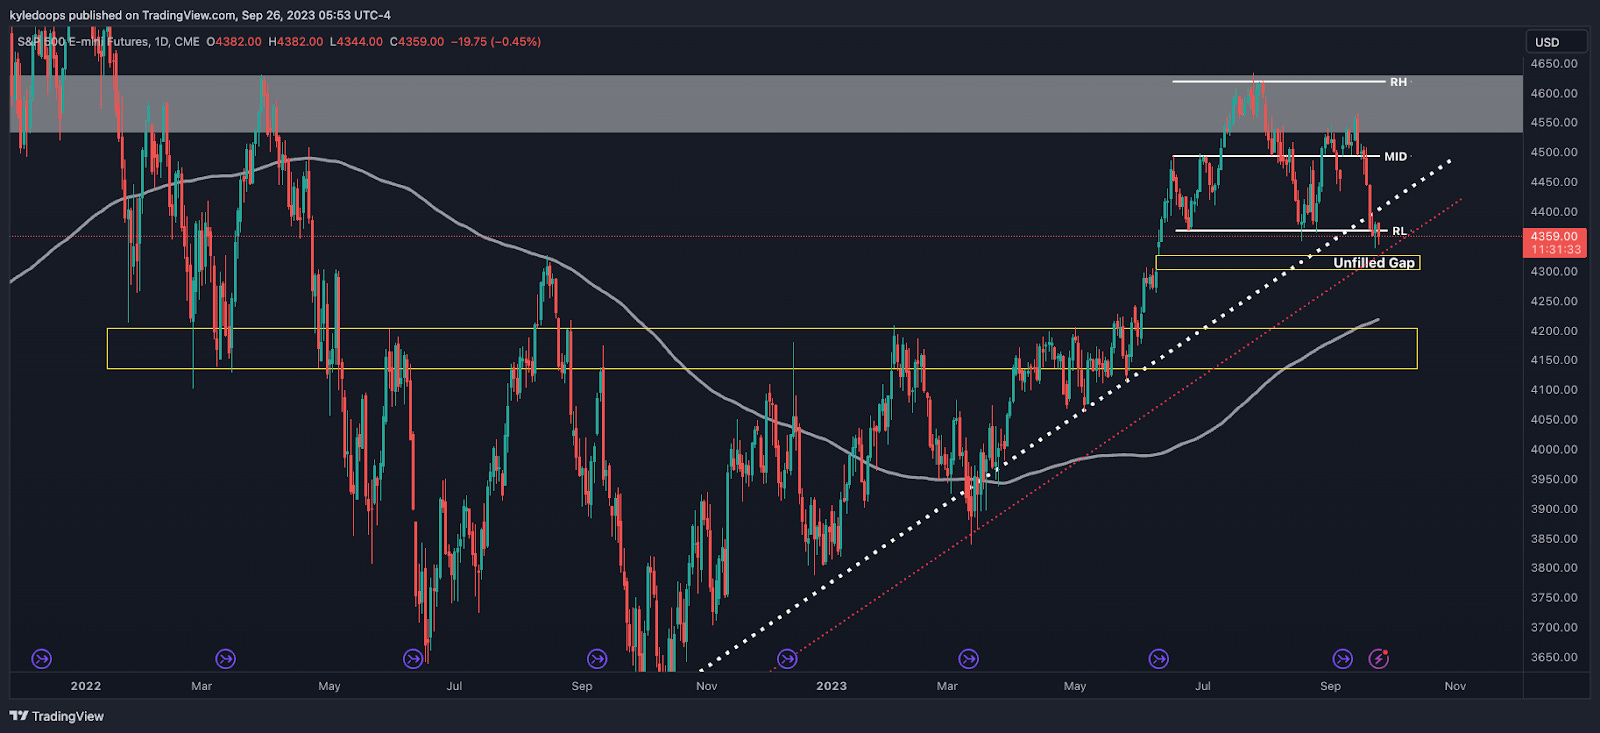
The S&P 500 is breaking through its main trend line, indicating a potential shift in momentum.
There is minor support at 4,300 due to the unfilled gap, and major support at 4,200. This 4,200 mark serves as a significant horizontal level and coincides with the 200-day moving average, which hasn't been retested since the price began its aggressive upward movement.
Bulls will aim to keep the price above that 200-day moving average.
Claim your Bitget sign-up bonuses here (details below).
Chart #3 - Coinbase (COIN) Weekly Chart
Chartist: Kyle

(For the chart screenshot, click here.)
Coinbase metrics have seen an uptrend since the launch of Base.
COIN is trading within a range, with the $40 level representing the range's low, also known as the discount zone.
For investors seeking altcoin exposure without holding the actual altcoins, acquiring Coinbase stock might be a safer option. This is particularly relevant for those wanting exposure to Base, as there isn't a specific Base token available.
Claim your Bitget sign-up bonuses here (details below).
Chart #4 - U.S. Dollar (DXY) Daily Chart
Chartist: Sheldon
(For the chart screenshot, click here.)
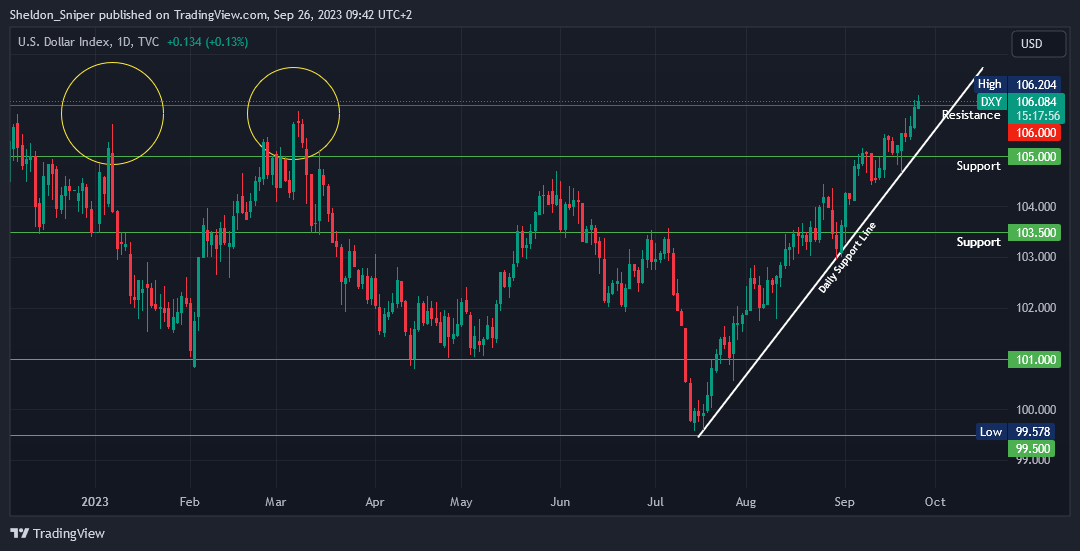
The DXY on the daily chart has reached the major resistance area of 106.00. This is the same point where the DXY faced rejection in January and March of this year.
It has steadily risen since mid-July and is currently overbought on higher time frames. Given this, I anticipate a potential rejection in this area, making the DXY reverse its trend and test lower support levels.
The initial support is the daily ascending support line from July, situated around 105.50. If this support line breaks, the next support stands at approximately 105.00..
Claim your Bitget sign-up bonuses here (details below).
Chart #5 - Fear and Greed Index
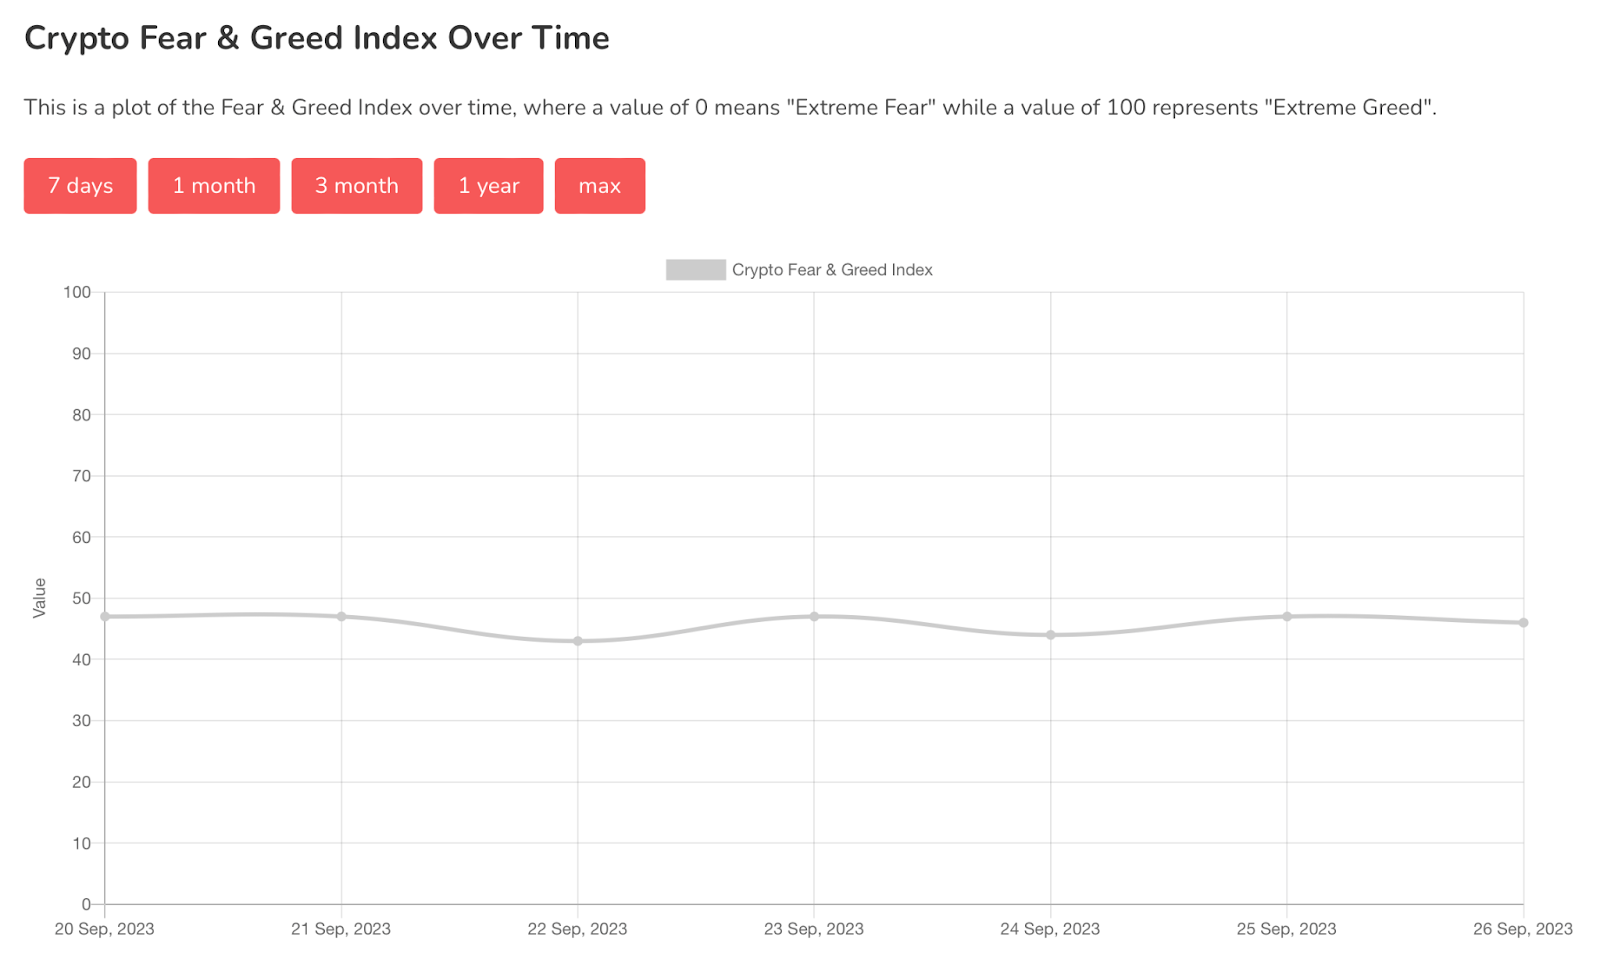
The Fear and Greed Index is sitting at 46 today, indicating Fear.
The highest the index has been over the past seven days is 47, and the lowest is 43.
Banter’s Take
There's ongoing downside risk, with the DXY consistently surging. When the DXY shows vulnerability and the stock market gains momentum, Bitcoin is likely to benefit.
Stay safe my friends!
Go to our Crypto Banter Discord here where Sheldon and Kyle give updates on the charts and trades from The Daily Candle newsletter!