

📈📉DXY Selling Off! Can BTC BREAK $30K?
📈📉DXY Selling Off! Can BTC BREAK $30K?
The upcoming weekly close will be CRUCIAL!
Overview
Chart #1 - Bitcoin (BTCUSDT) 4-Hour
Chart #2 - U.S. Dollar (DXY) Weekly
Chart #3 - Solana to Bitcoin Ratio (SOLBTC) Daily
Chart #4 - Polygon (MATICUSDT) Daily
Chart #5 - Fear and Greed Index

Chart #1 - Bitcoin (BTCUSDT) 4-Hour
Chartist: Sheldon
(For the chart screenshot, click here.)
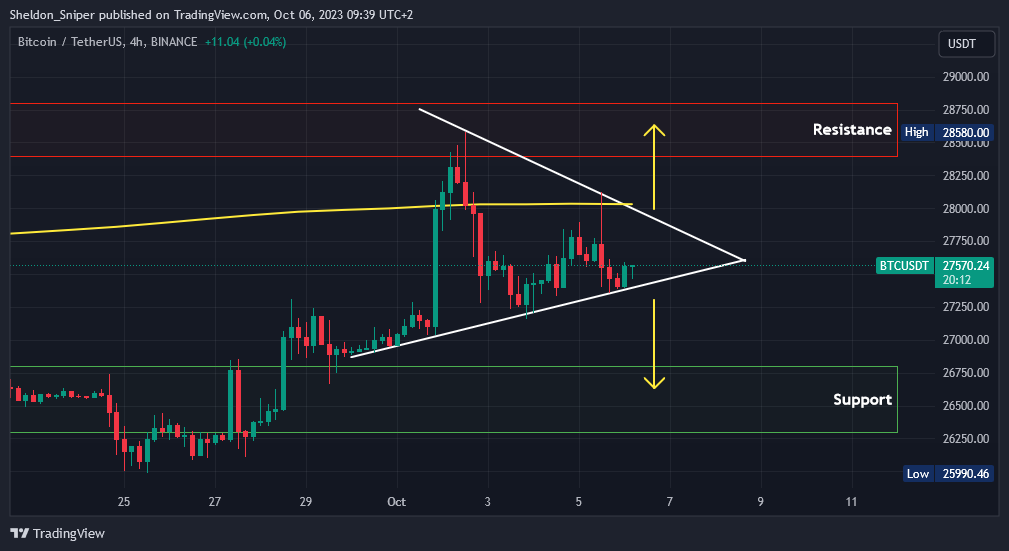
Over the last week, Bitcoin has been consolidating in a bullish pennant structure, where the price has been creating lower highs and higher lows on the 4HR time frame.
The candles are getting very close to the end of the pennant structure, and a decision will be made fairly shortly as to whether the price will break to the downside or the upside, out of the structure. This afternoon, we have the US non-farm payroll data coming out, which could be the catalyst for a big move in BTC.
If the break of the pennant structure is to the downside, then the next area of support is between $26,300 - $26,800. If the price of BTC breaks out to the upside, including through the daily 200 Moving Average (Yellow Line), then the next resistance target will be in the area of $28,350 - $28,850, which is the same area that was tested at the beginning of this week.
Sign-up and trade on Bybit today.
Exclusive $30,000 deposit rewards and bonuses up for grabs!
Chart #2 - U.S. Dollar (DXY) Weekly
Chartist: Kyle
(For the chart screenshot, click here.)
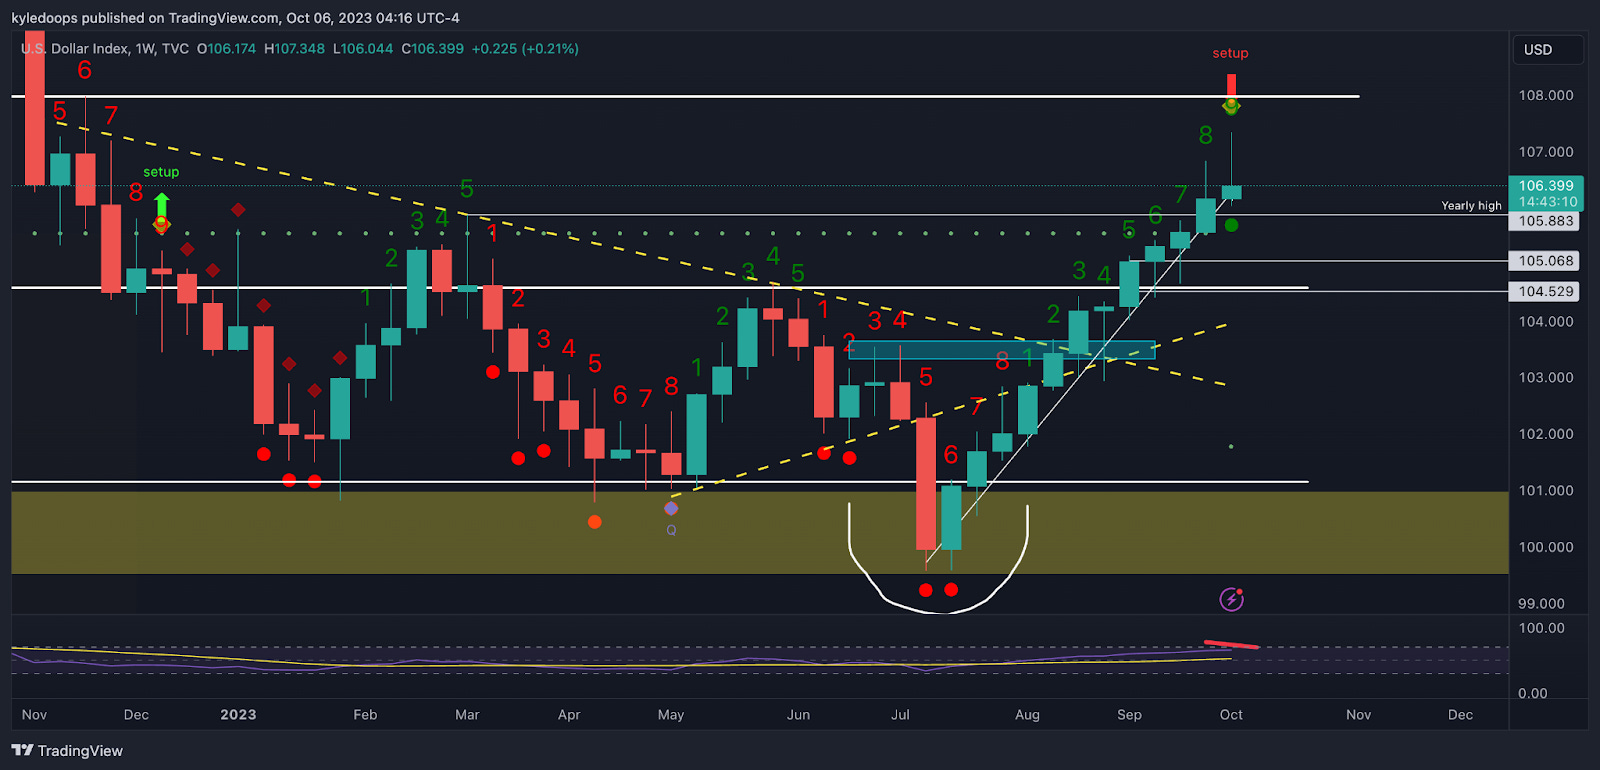
The DXY on the weekly is selling off again as we approach the end of the 12th green week while on a Tom De Mark TD9 sell signal.
The signal suggests a 1-3 week correction can be expected and trend exhaustion.
Watch this chart's close and next week's open. If it tops, next week could show some upside for Bitcoin.
Claim your Bitget sign-up bonuses here (details below).
Chart #3 - Solana to Bitcoin Ratio (SOLBTC) Daily
Chartist: Kyle
(For the chart screenshot, click here.)
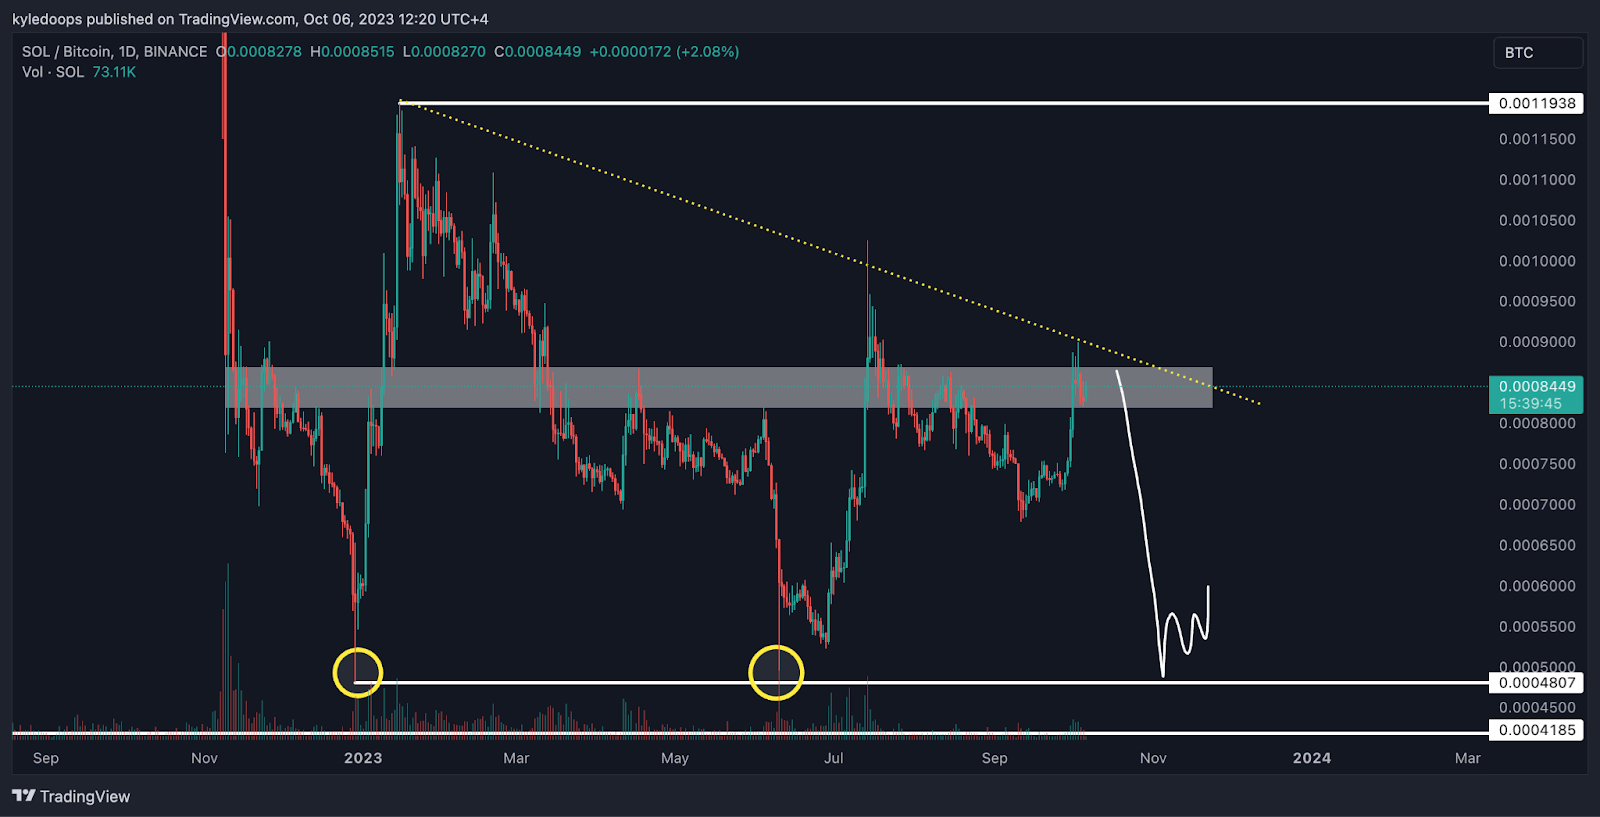
SOL/BTC daily is coming into resistance with a bearish retest of the trend line.
The expectation would be a rejection from here and revisiting the 0.0004807 level, which is the range low.
We’ll correlate this chart with SOL/USD as it approaches upside resistances and consider taking longs off the table there, expecting a pullback.
Claim your Bitget sign-up bonuses here (details below).
Chart #4 - Polygon (MATICUSDT) Daily
Chartist: Sheldon
(For the chart screenshot, click here.)
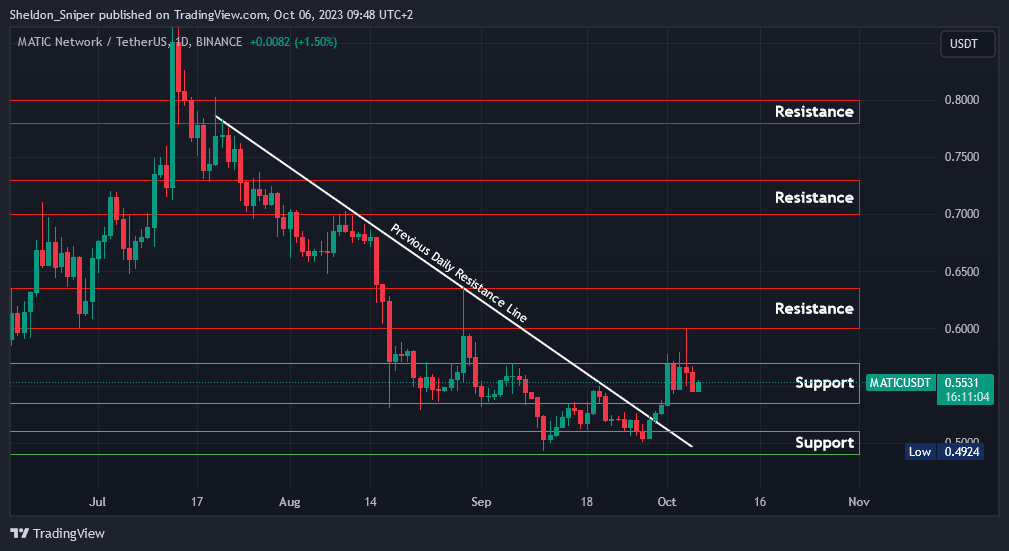
MATIC is currently trading around $0.55.
The $0.55 - $0.5650 range is holding as support, with the potential for the price to rise and test the next resistance area at $0.60 - $0.64, or even the $0.70 level, which was last tested at the beginning of August.
Claim your Bitget sign-up bonuses here (details below).
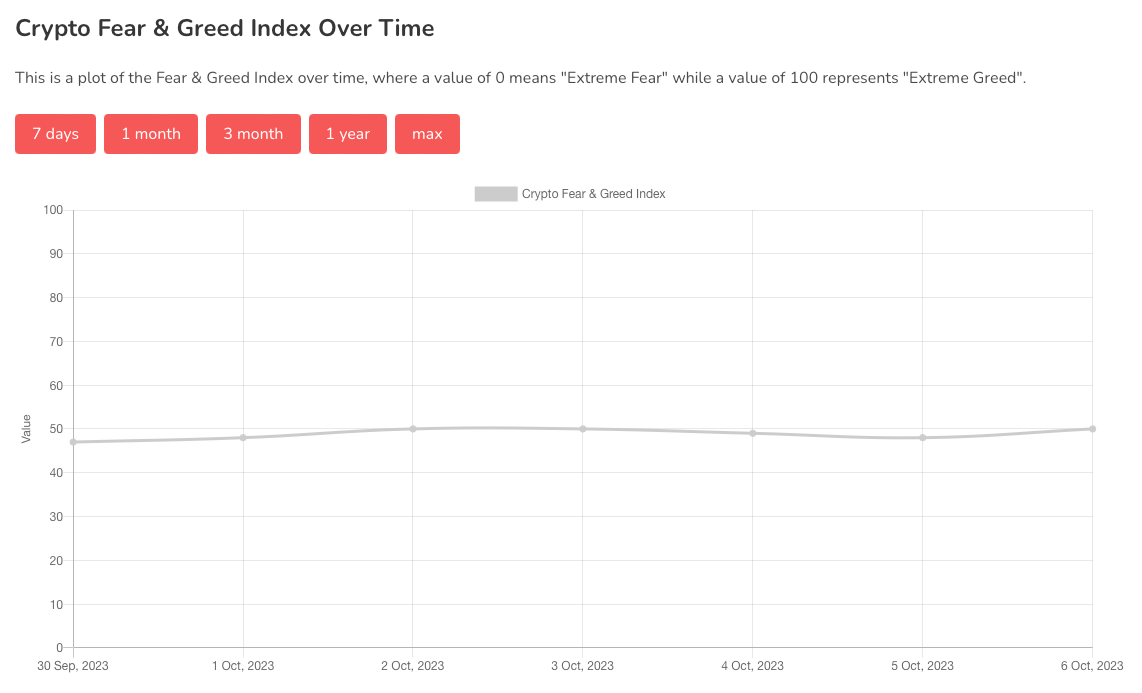
Chart #5 - Fear and Greed Index
The Fear and Greed Index is sitting at 50 today, Neutral.
The highest the index has been over the past seven days is 50, and the lowest is 47.
Banter’s Take
The altcoin market continues to oscillate sideways, with Bitcoin maintaining its dominance after reclaiming some crucial levels. The upcoming weekly close will be revealing, as Bitcoin is poised to close above the 21 EMA on the weekly if it maintains this level or rises. This suggests that next week could offer the chance to break resistances above $30,000.
Stay safe my friends!
Go to our Crypto Banter Discord here where Sheldon and Kyle give updates on the charts and trades from The Daily Candle newsletter!