

📈📉 DXY's Double Bottom: Bearish Sign Ahead?
📈📉 DXY's Double Bottom: Bearish Sign Ahead?

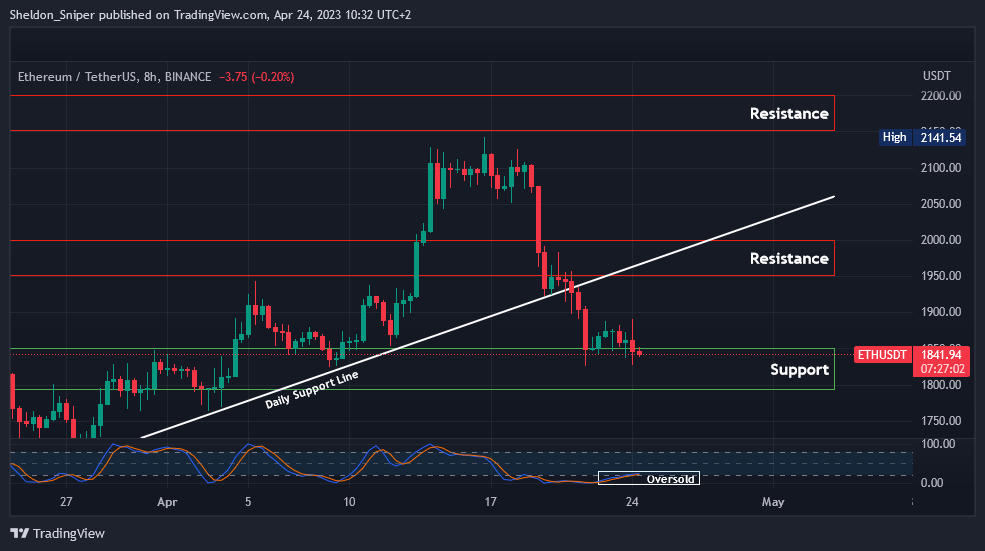
Chart #1 - Ethereum (ETHUSDT) 8-Hour Chart
Chartist: Sheldon
(For the chart screenshot, click here.)
Over the past week, ETH retraced with the rest of the market, dropping from last week’s high of $2,140 to $1,850.
The STOCH RSI on the medium and daily time frames is oversold, but I believe ETH can still drop lower, to $1,800, before we see a trend reversal. If support is found at $1,800, and there is a bounce back up, the next area of resistance is between $1,950 - $2,000.
If the price gets back up to $1,950 but gets rejected there, ETH will then test lower levels of support between $1,700 - $1,750, and $1,500 - $1,600.
𝗣𝗿𝗶𝗺𝗲 𝗫𝗕𝗧
Sign up for a new Trading Account on Prime XBT!
Receive a deposit bonus of up to $7,000 with promo code: SheldonSniper
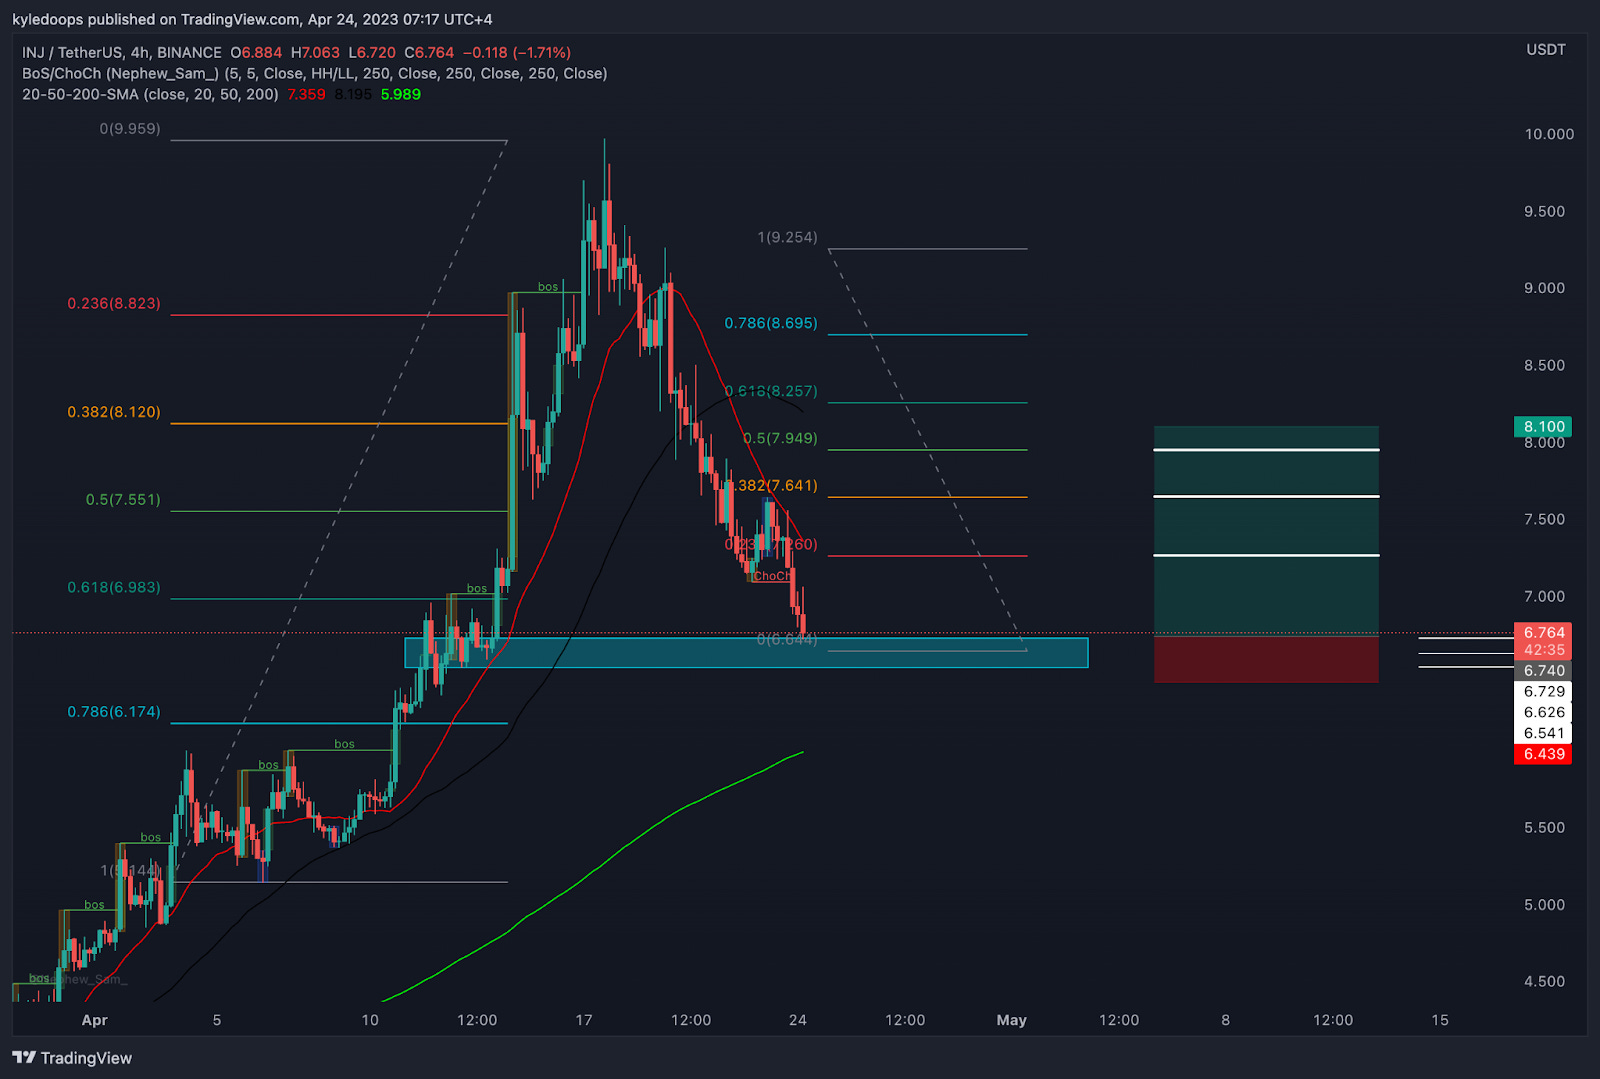
Chart #2 - Injective (INJUSDT) 4-Hour Chart
Chartist: Kyle
(For the chart screenshot, click here.)
INJ has just started to approach its demand zone!
If it manages to hold this level and the 4-hour candles start showing some increased buying pressure, I’ll open a long trade with a very tight stop below 6.43.
This is not a long-term trade but simply a quick one, and I will move my stop loss to break even as soon as INJ starts moving.
𝗣𝗿𝗶𝗺𝗲 𝗫𝗕𝗧
Sign up for a new Trading Account on Prime XBT!
Receive a deposit bonus of up to $7,000 with promo code: KyleDoops

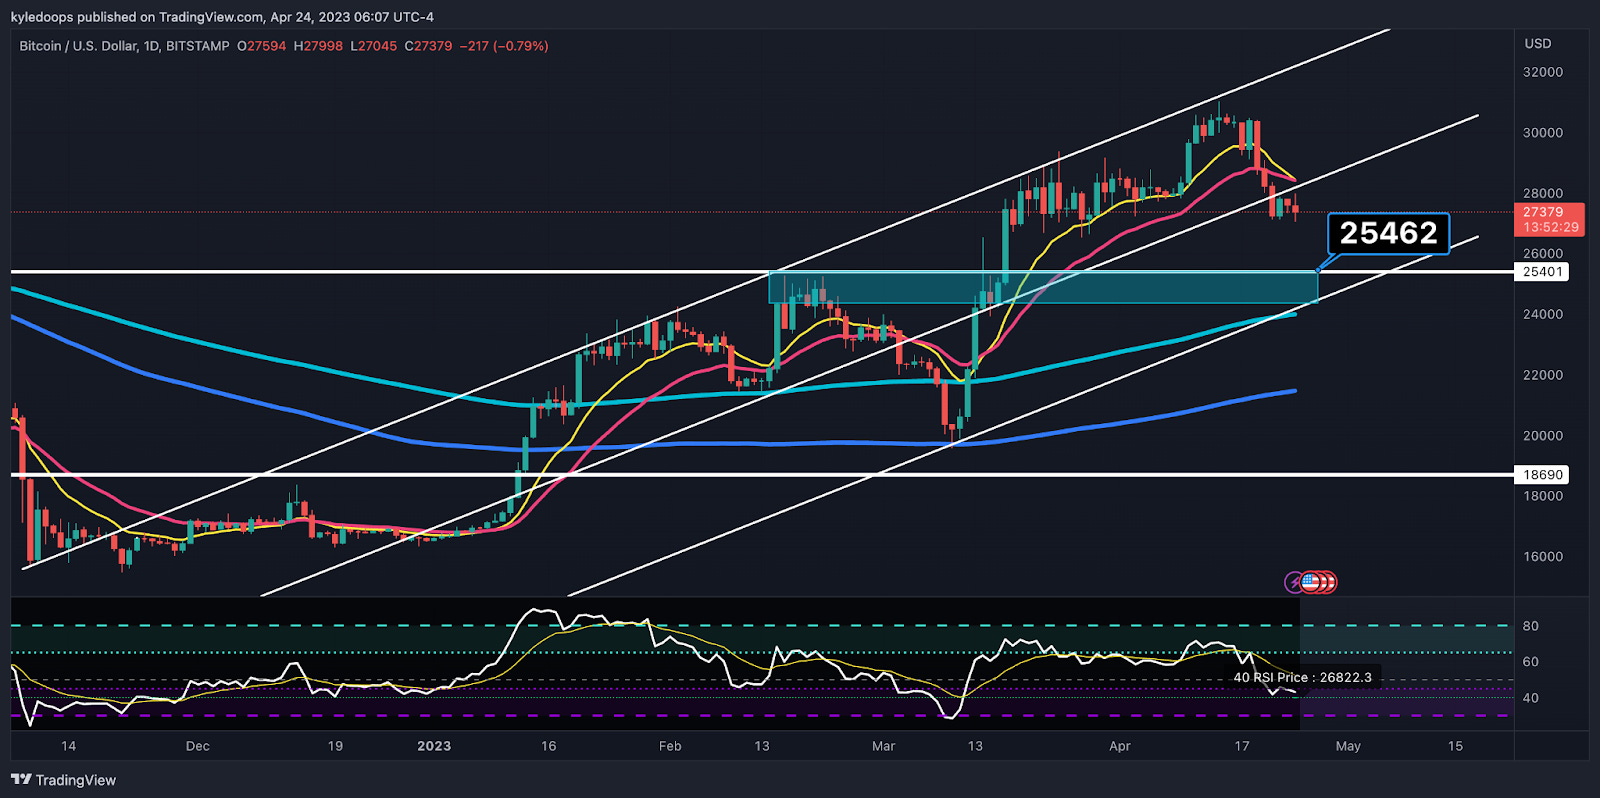
Chart #3 - Bitcoin (BTCUSD) 1-Day Chart
Chartist: Kyle
(For the chart screenshot, click here.)
Bitcoin is still consolidating within an ascending channel.
The price set a local top at $31,000 with a reversal candle, and now is going through a broader correction. The primary area of interest over the coming weeks is the blue demand zone highlighted on the chart at $25,462.
The 9 and 18 EMAs have initiated a bearish cross down, and the price will be under pressure until that changes. The light blue 200 EMA will add additional support once the price reaches the demand zone.
Expect, at the very least, a small bounce from that area.
Claim your Bitget sign-up bonuses here (details below).
HUGE BYBIT TRADING COMPETITION!!!
Join The EXCLUSIVE Crypto Banter & Gareth Soloway ByBit Trading Competition!
Trade to win the biggest prizes in crypto, such as a TESLA, a ROLEX, and $10,000 CASH Prizes!
Register RIGHT NOW by clicking here.
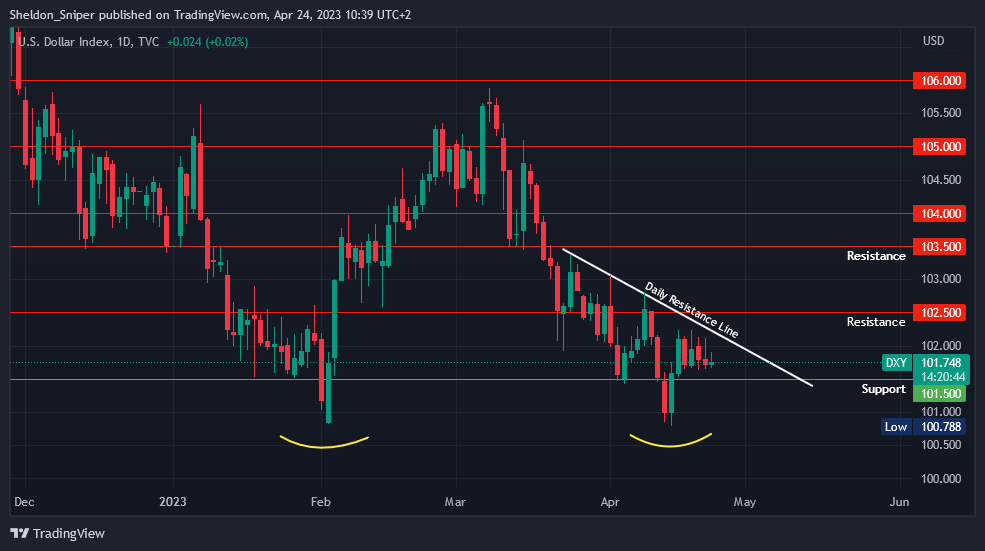
Chart #4 - DXY 1-Day Chart
Chartist: Sheldon
(For the chart screenshot, click here.)
Over the last seven months, the DXY has been in a downtrend but has now found support at 101.50.
The DXY has made two attempts over the last two months to break that level, creating a double bottom (usually bullish) in the process. If it breaches the daily descending resistance line and reclaims 102.5 on higher time frames, it will bring further upside.
Traditionally, May has not been the best month for stocks and crypto, so now is the time to pay close attention to how things are playing out.
Claim your Bitget sign-up bonuses here (details below).
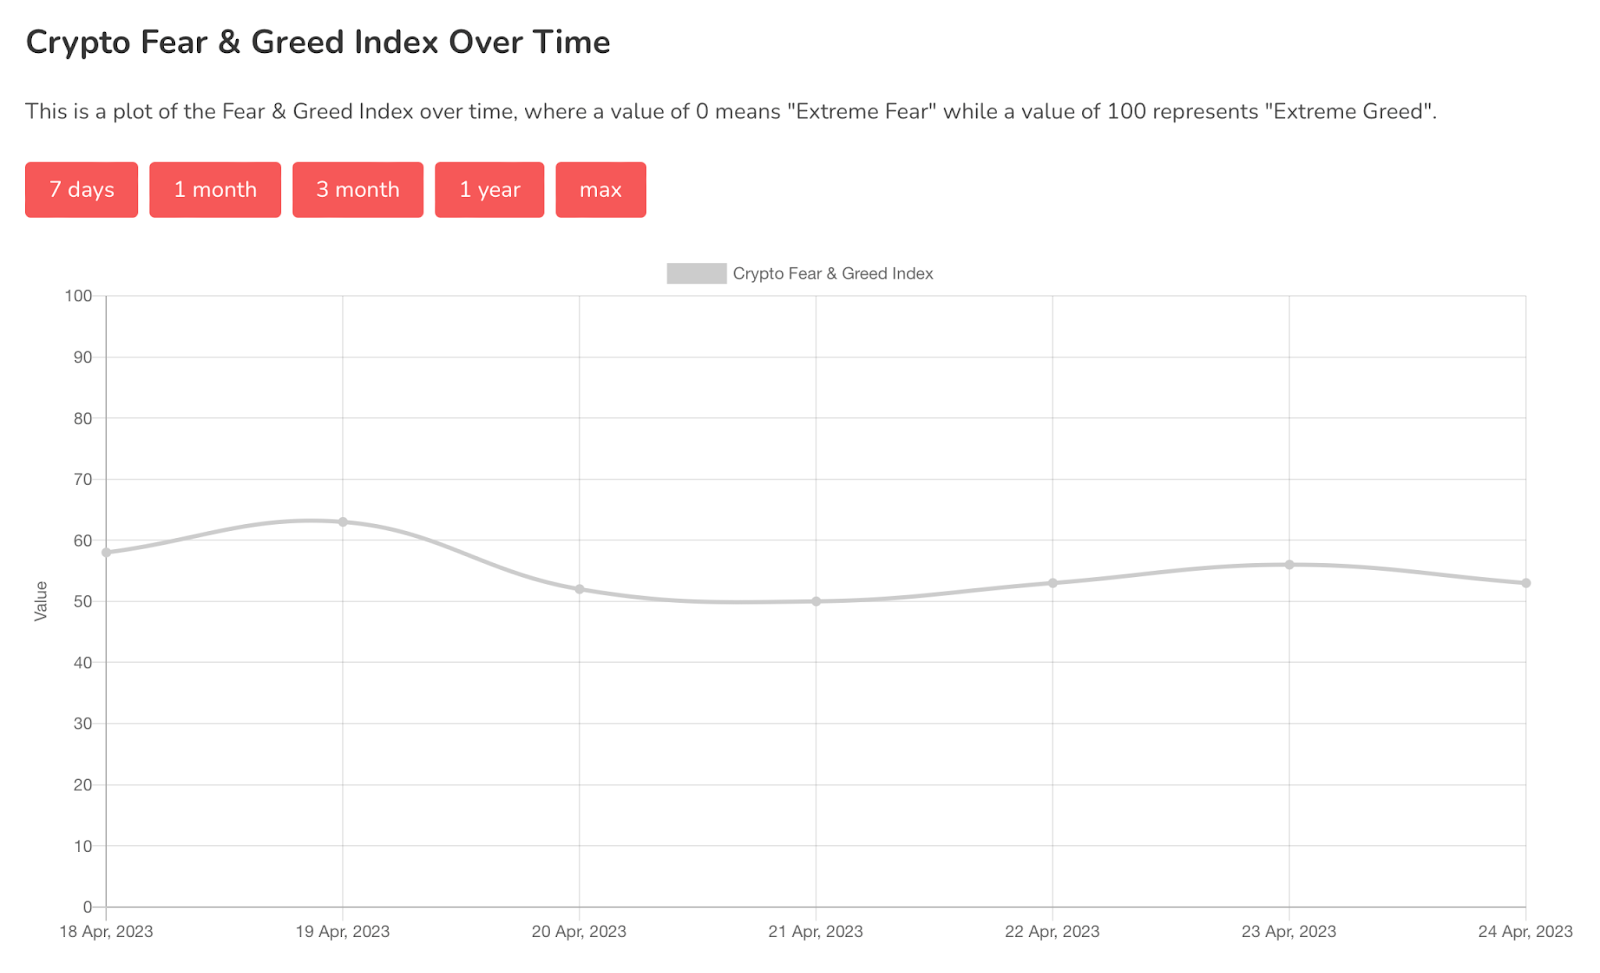
Chart #5 - Bitcoin Fear and Greed Index
The Bitcoin Fear and Greed Index is sitting at 53 today, Neutral.
The highest the index has been over the past seven days is 63, and the lowest is 50.
Banter’s Take
Bitcoin might take one more sweep lower. But then, market participants should start preparing for a big bounce. Whether that bounce sets in a lower high (signaling bearish continuation) is yet to be seen. For now, we will play it level to level.
Stay safe my friends!
Go to our Crypto Banter Discord here where Sheldon and Kyle give updates on the charts and trades from The Daily Candle newsletter!