

📈📉 End of bear market signal flashes on bitcoin! Can we trust it?
📈📉 End of bear market signal flashes on bitcoin! Can we trust it?

Bitget winner - 9977449660
Wondering what that 👆 is and how you can win? Then check out our daily shows on YouTube!
Are you using Bybit instead? Then look for the winning Bybit account below. But if you want to double your chances of winning, sign up today to both exchanges with the links found in the description of our YouTube videos!
Good luck to all!
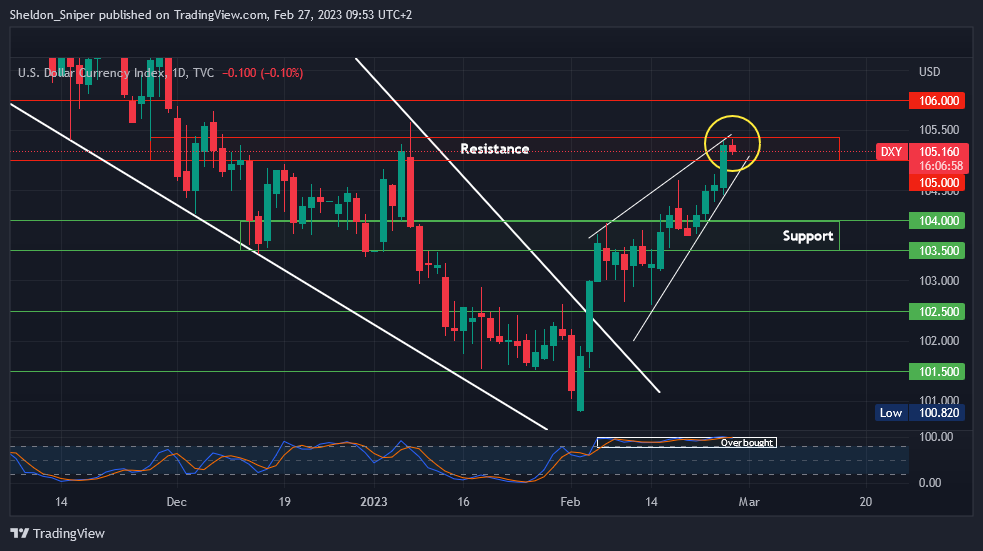
Chart #1 - DXY 1-Day Chart
Chartist: Sheldon
(For the chart screenshot, click here.)
The DXY has reached resistance at 105 - 105.50. It is overbought on the daily chart and has been in a rising wedge structure since the beginning of February, meaning there is a high chance of it breaking to the downside.
If the DXY drops from here, the next significant support is between 103.50 - 104, followed by the 101.50 level. Upwards, the next resistance area is at 106.50 - 107, where the 200-day Moving Average intersects.
Check our Crypto Banter Discord here for updates!
Follow me on Twitter for urgent updates on my trading progress!
Claim your Bitget sign-up bonuses here (details below).
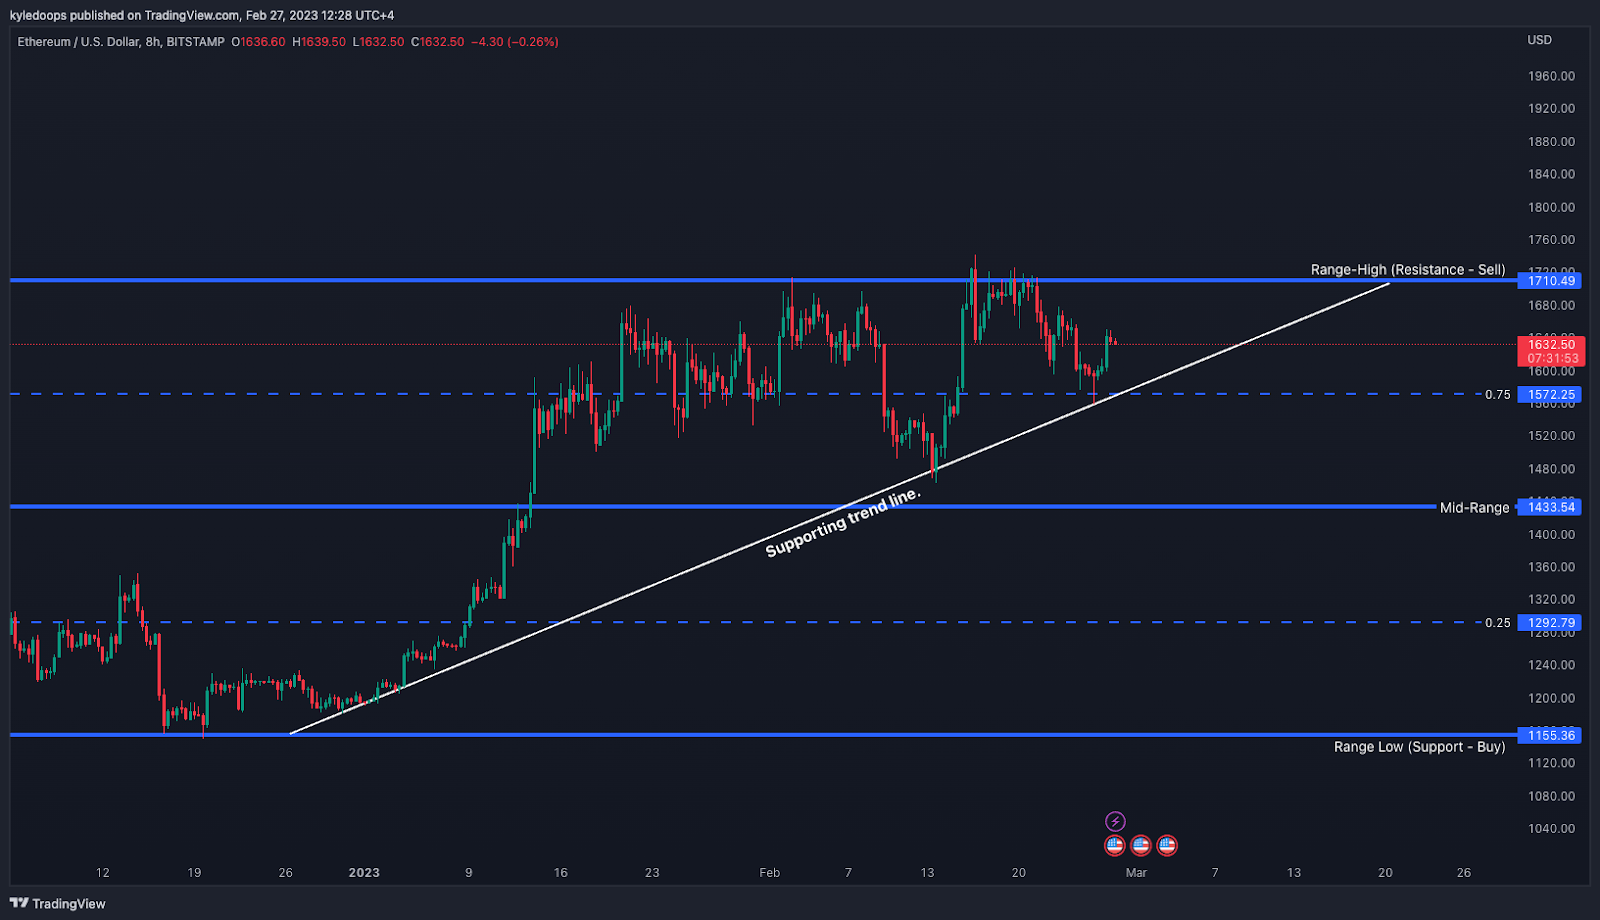
Chart #2 - Ethereum (ETHUSD) 8-Hour Chart
Chartist: Kyle
(For the chart screenshot, click here.)
Bulls will want ETH's current level to hold and form a higher low. If that happens, another push to $1,710 becomes increasingly likely.
But, if ETH takes out its current low at $1,558, the next target becomes the mid-range level at $1,433.
Check our Crypto Banter Discord here for updates!
Make sure to follow me on Twitter, where I will post updates on my trades as they unfold!
Claim your Bitget sign-up bonuses here (details below).
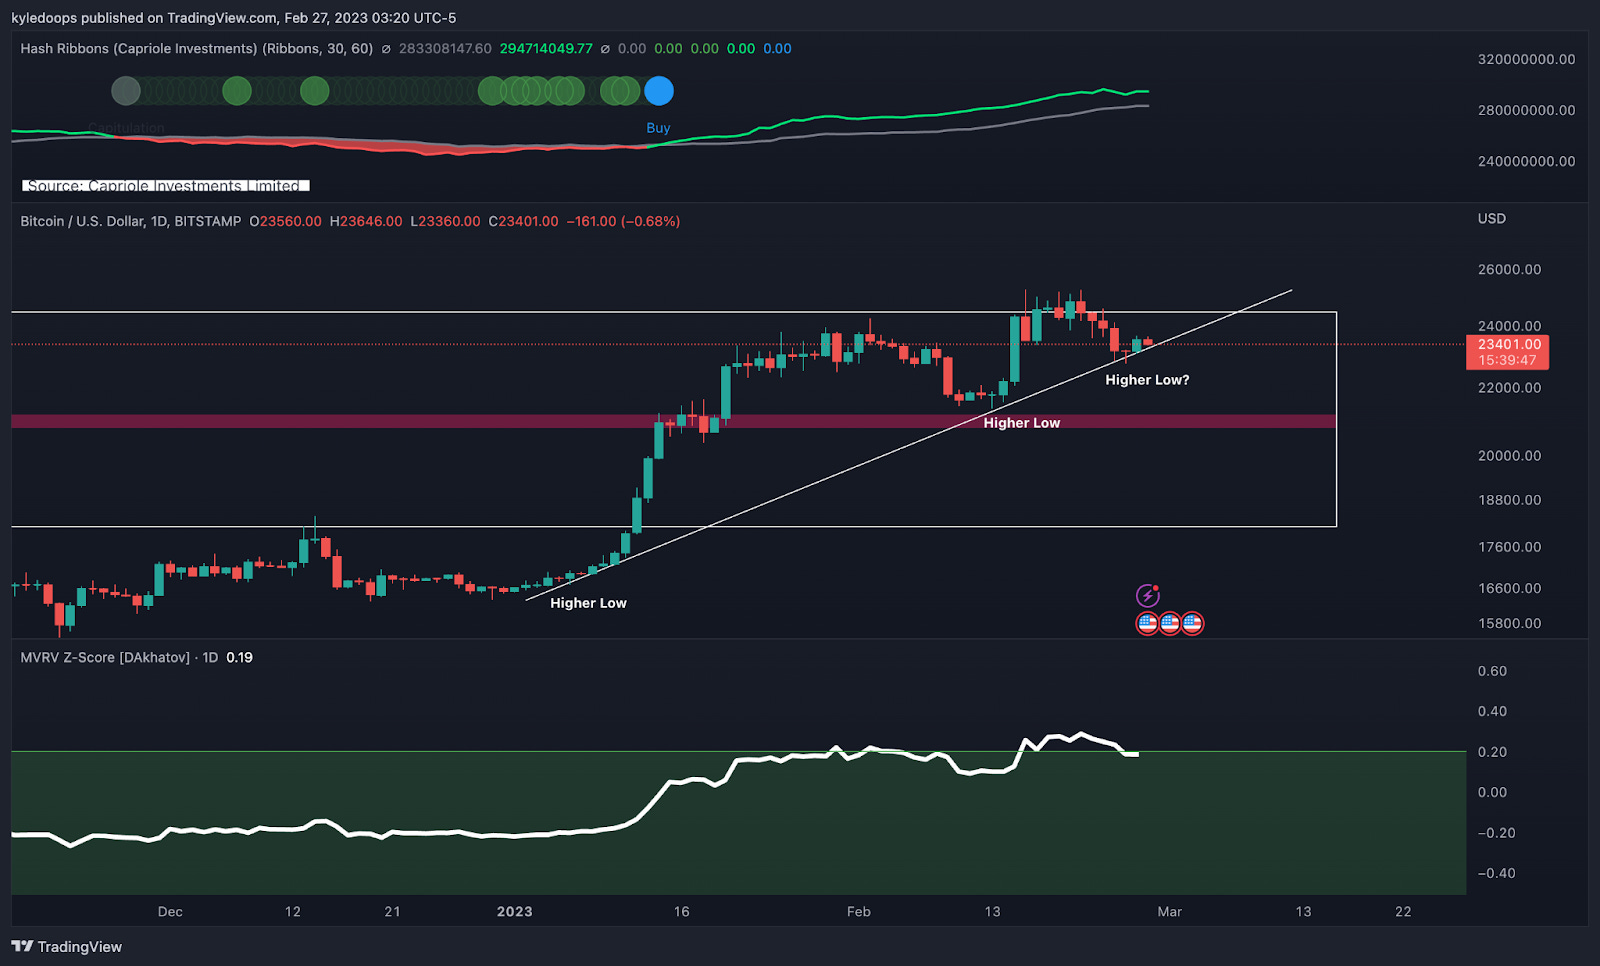
Chart #3 - Bitcoin (BTCUSD) 1-Day Chart
Chartist: Kyle
(For the chart screenshot, click here.)
Bitcoin may be forming its next higher low on the daily chart, where bulls will want to see $22,791 hold.
If so, the next target will be $26,500. If we overlay the hash ribbons (which relate to miner profitability), the pattern suggests the market is shifting from bearish to bullish. As you can see, the blue buy signal has flashed which, historically, has had a high hit rate.
The MVRV-Z score has also started to come out of the green lower band. Historically, this has ended every bear market.
Ultimately, all price action hangs on the current level holding as a higher low. Failure to do so would mean the price will most likely head back to the mid-range level at $21,000.
Check our Crypto Banter Discord here for updates!
Make sure to follow me on Twitter, where I will post updates on my trades as they unfold!
Claim your Bitget sign-up bonuses here (details below).
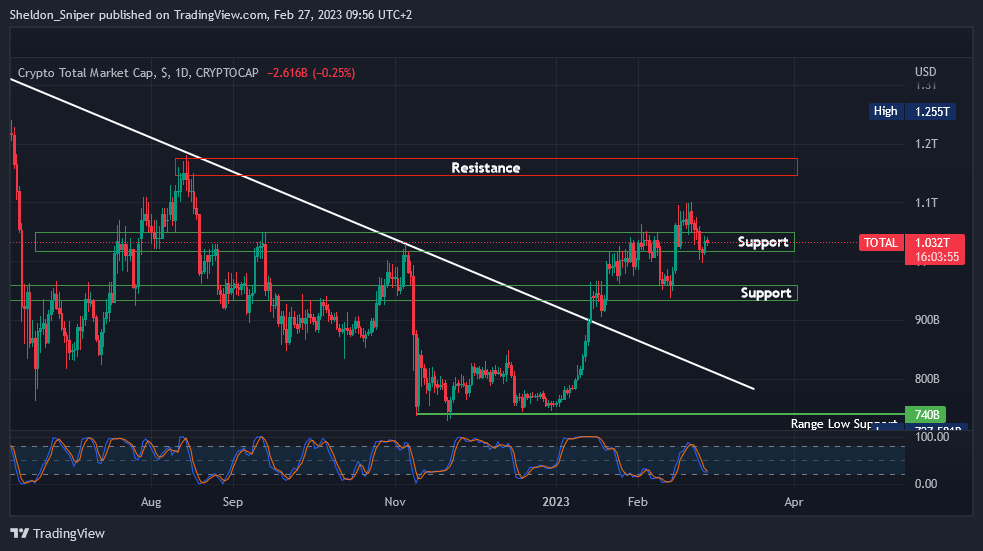
Chart #4 - TOTAL 1-Day Chart
Chartist: Sheldon
(For the chart screenshot, click here.)
The TOTAL is holding the $1T level as support for now.
With the indicators resetting on the higher time frames, there is a chance the market could go up this week to test the next resistance levels at $1.1T and $1.5T.
If it fails to do so and loses the $1T level of support, the next one is between $920B - $940B, followed by the $850B - $875B zone.
Check our Crypto Banter Discord here for updates!
Follow me on Twitter to get all the updates on my personal trading progress!
Claim your Bitget sign-up bonuses here (details below).
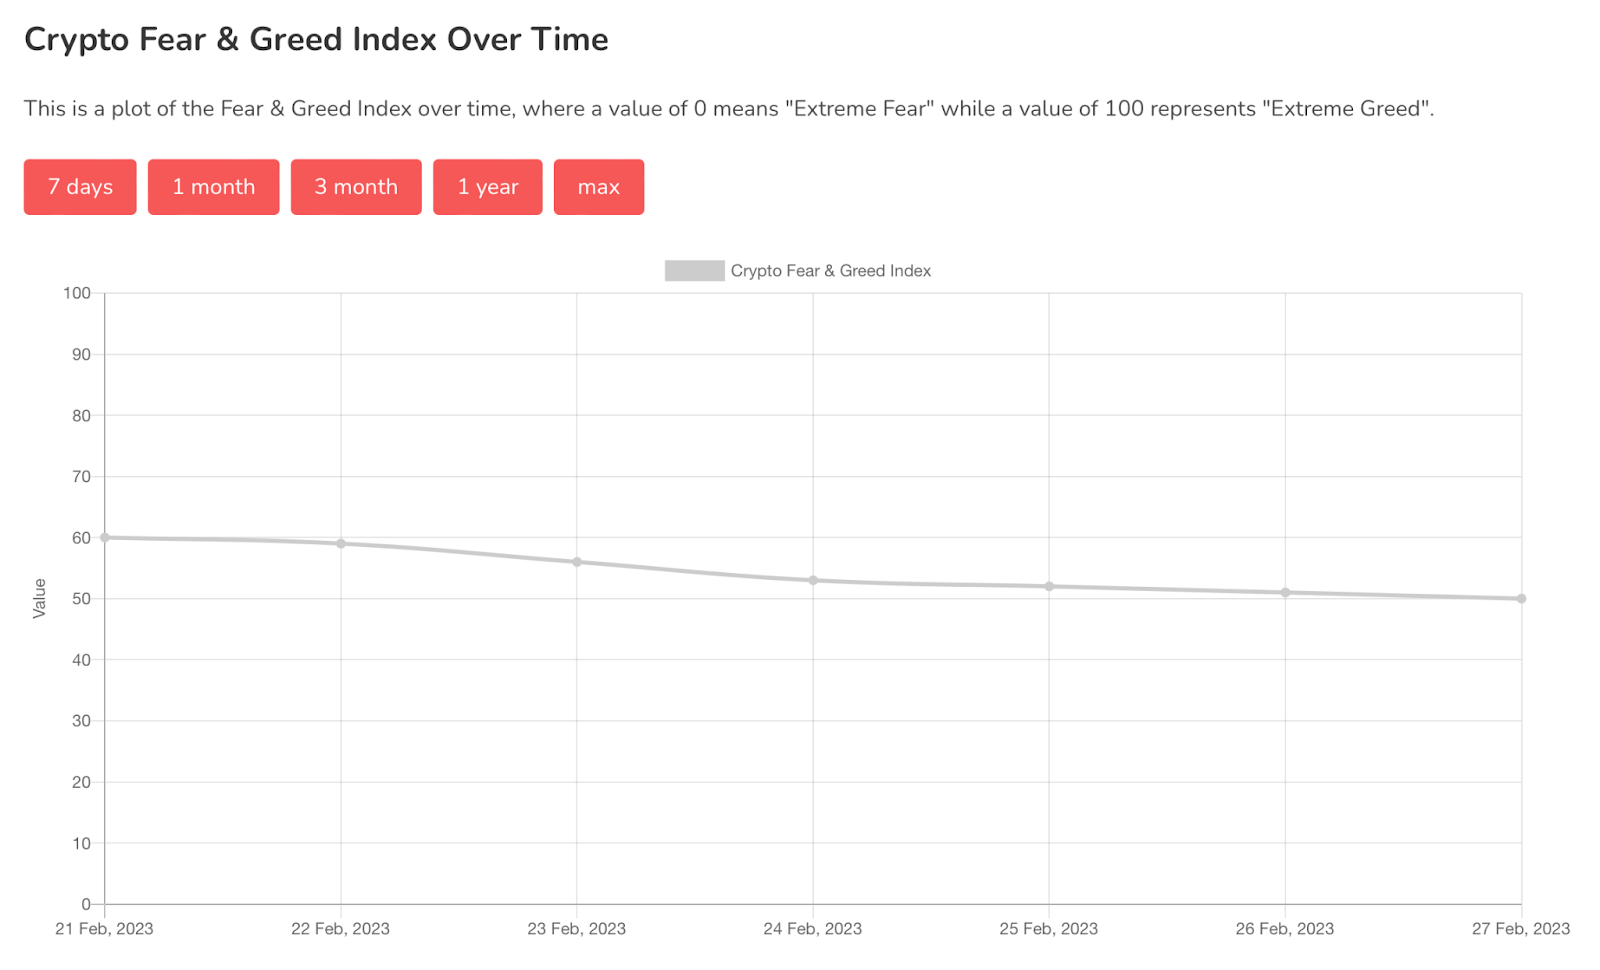
Chart #5 - Bitcoin Fear and Greed Index
The Bitcoin Fear and Greed Index is sitting at 50 today, Neutral.
The highest the index has been over the past seven days is 60, and the lowest is 50.
Overall Market Sentiment (Banter’s Take)
The high time frames suggest that the market has seen a bottom. And the low timeframes suggest that most crypto assets have broken back into their long-term ranges, and revisiting their mid-range levels is highly likely.
The markets are predominantly driven by liquidity, so keeping an eye on it over the next few months will be important for timing long-term entries.
Stay safe my friends!
Bybit winner - 26211758