

📈📉 ETH 56% BREAKOUT to $3,300 Incoming?
📈📉 ETH 56% BREAKOUT to $3,300 Incoming?
PLUS: RLB About to CRASH?
Overview
Chart #1 - Bitcoin (BTCUSD) 2-Week
Chart #2 - Rollbit Coin (RLBUSD) Daily
Chart #3 - Ethereum to Bitcoin Ratio (ETHBTC) Daily
Chart #4 - Decentraland (MANAUSDT) Daily
Chart #5 - Fear and Greed Index
Chart #1 - Bitcoin (BTCUSD) 2-Week
Chartist: Sheldon
(For the chart screenshot, click here.)
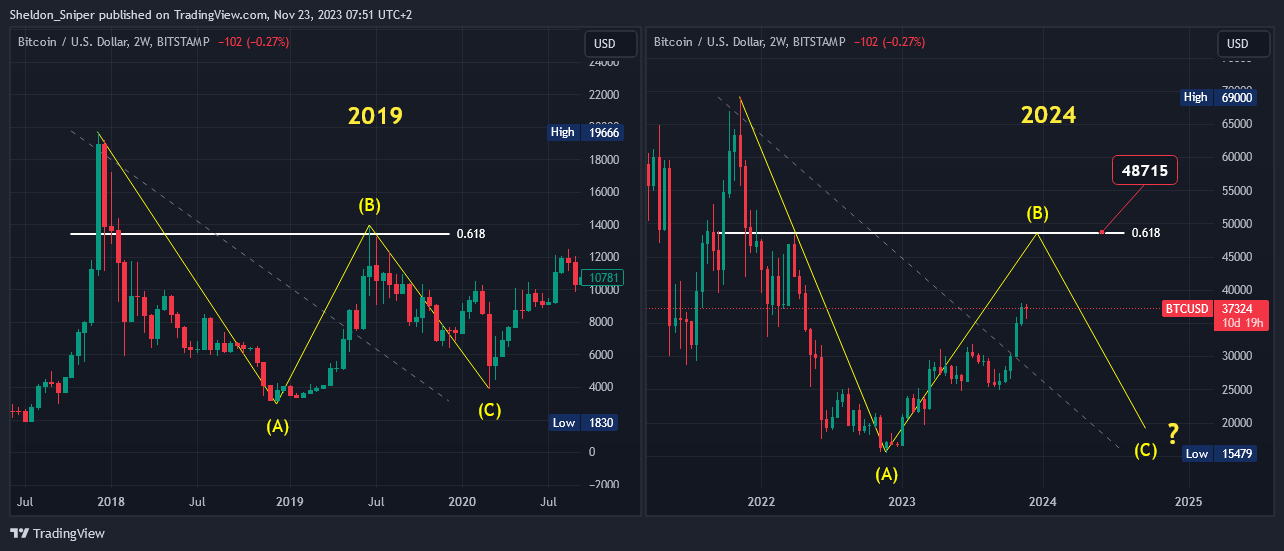
Today we compare the current Bitcoin cycle vs. the 2019 cycle.
Back then, BTC corrected from the all-time high at the end of 2017, in an ABC wave pattern. Coming from the end of the 2017 high, the price retraced down to a low below $4,000, completing the A leg down; the price then found support and reversed back up to complete the B leg up, where it once again found resistance at the 0.618 Fibonacci level. The price then got rejected at that level, and once again retraced down to complete the C leg.
If history is going to repeat itself, then last year was the A leg down, before finding support at the end of last year, where the price then reversed back to the upside. During 2023, BTC has possibly been in the B leg up to the 0.618 Fibonacci level at around $48,000.
If it gets rejected at the 0.618 level at around $48,000, then there could be another retracement to the downside in 2024 to complete the C leg to the downside.
Sign-up and trade on Bybit today.
Exclusive $30,000 deposit rewards and bonuses up for grabs!
Chart #2 - Rollbit Coin (RLBUSD) Daily
Chartist: Kyle
(For the chart screenshot, click here.)
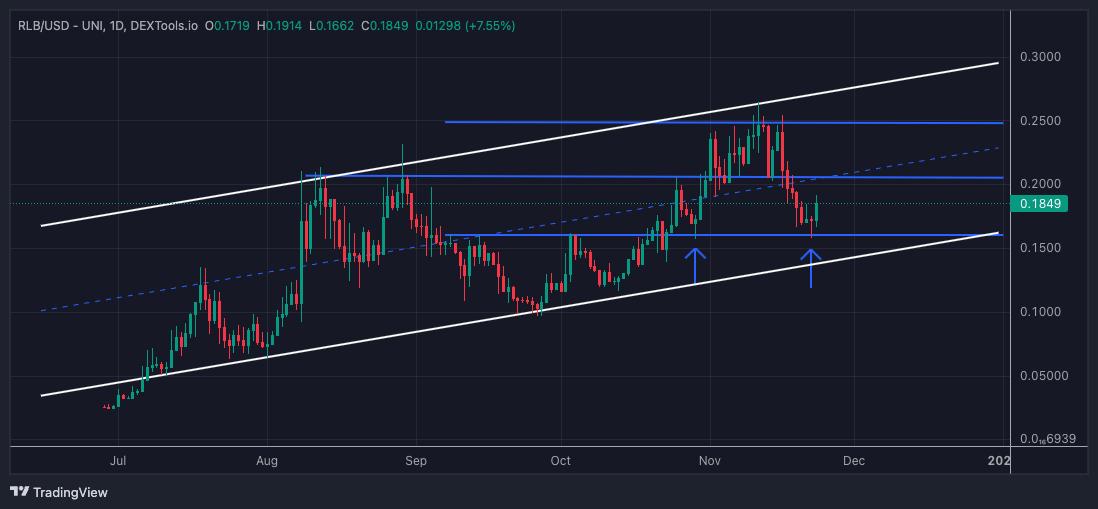
RLB looks like it could bounce from a pretty key level here.
Yesterday’s daily candle is showing signs of reversing. It would be a good idea to scale in and not deploy all in one go.
If this horizontal gets lost, then the next support is the diagonal line, which is the bottom of the channel at $0.1374.
Claim your Bitget sign-up bonuses here (details below).

Outsmart 99% Of The Market!
Get full access into our Discord And Telegram group, where you'll find all of our premium content!
👉 Trade Signals!
👉 Trade Set-Ups!
👉 Trading Challenges!
👉 Education!
👉 SO MUCH MORE!
Chart #3 - Ethereum to Bitcoin Ratio (ETHBTC) Daily
Chartist: Kyle

(For the chart screenshot, click here.)
ETH/BTC on the left chart is attempting to reclaim the range low at 0.05578. If this happens, ETH/USD likely starts to break out.
ETH/USD is on the right-hand side. Price is caught in an ascending triangle which shows higher lows and equal highs. If price starts closing daily candles above the $2,120 level, that will confirm the breakout of ETH.
ETH has a measured move up to $3,300, which is a 56% move.
Claim your Bitget sign-up bonuses here (details below).
Chart #4 - Decentraland (MANAUSDT) Daily
Chartist: Sheldon

(For the chart screenshot, click here.)
At the beginning of November, MANA broke out of its descending resistance line that from May 2022, at $0.3750.
Yesterday, it came down to retest that break.
Price is now oversold, so I expect MANA to consolidate before testing $0.50 - $0.58.
Claim your Bitget sign-up bonuses here (details below).
Chart #5 - Fear and Greed Index
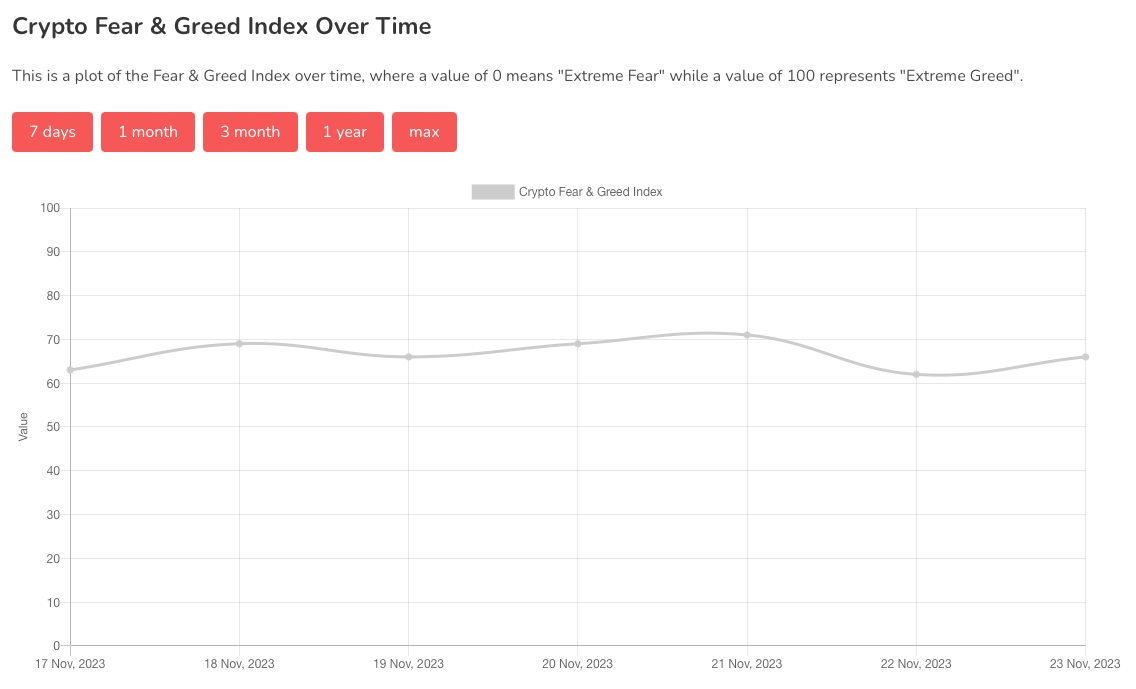
The Fear and Greed Index is sitting at 66 today, indicating Greed.
The highest the index has been over the past seven days is 71, and the lowest is 62.
Banter’s Take
Prices keep grinding up, but eventually, there will be a sweep down for BTC, which will take the lower liquidity that is building up below.
What this means is it’s wise to have some cash in the event of a dip-buying opportunity!
Stay safe my friends!
Go to our Crypto Banter Discord here where Sheldon and Kyle give updates on the charts and trades from The Daily Candle newsletter!