

📈📉 ETH & BTC Long Entry Levels Spotted! STX is Bullish!
📈📉 ETH & BTC Long Entry Levels Spotted! STX is Bullish!

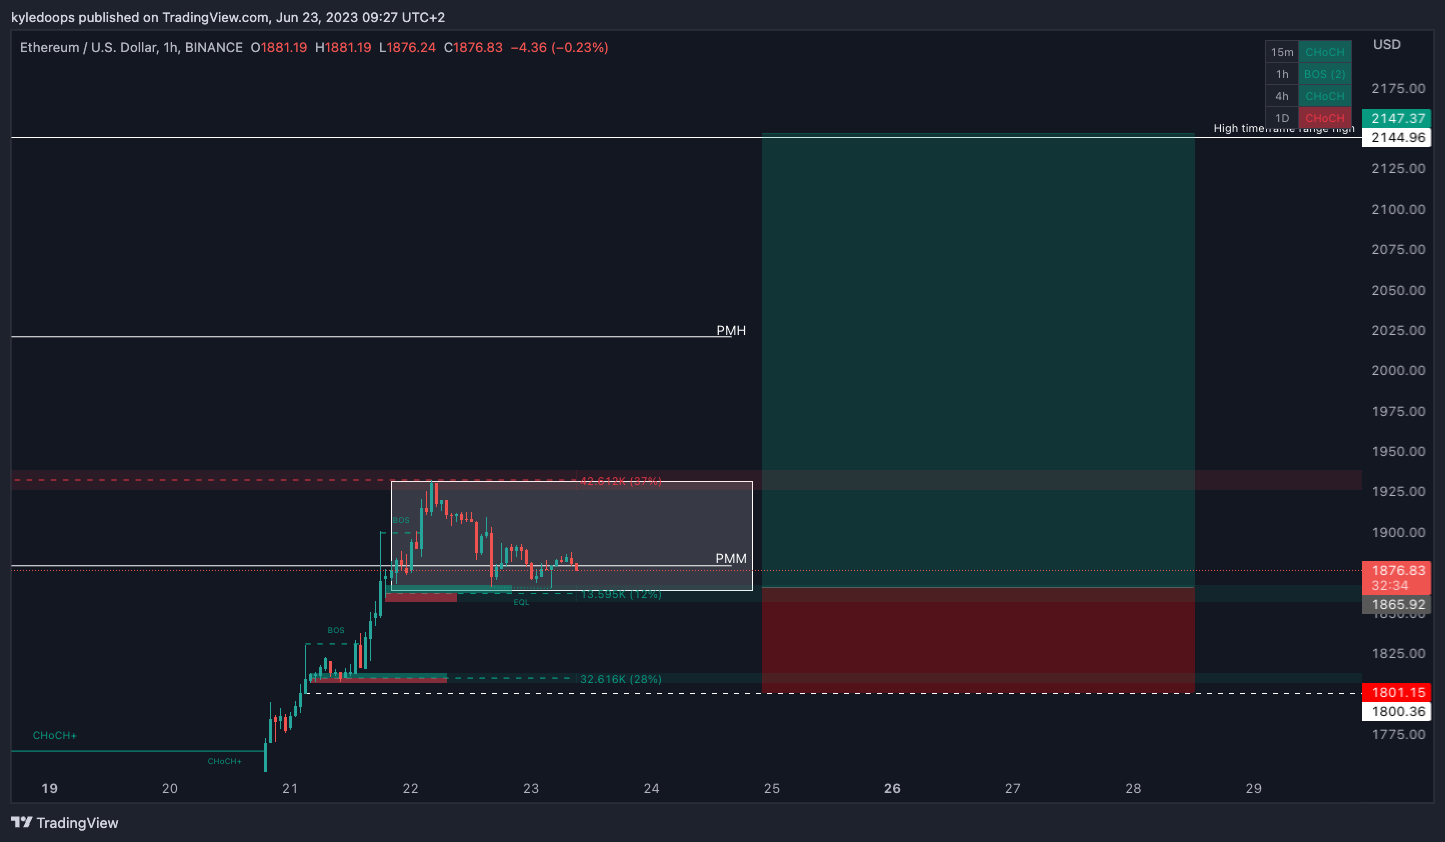
Chart #1 - Ethereum (ETHUSD) 1-Hour Chart
Chartist: Kyle
(For the chart screenshot, click here.)
ETH has a setup almost identical to Bitcoin's. It is forming a bull flag on the 1-hour timeframe.
Any sweep below $1,865 should be seen as an opportunity to go long. A reclaim above the previous month's mid-level (labeled PMM) would provide additional confidence in this trading idea.
The take-profit target would be the high timeframe range high at $2,144.
𝗣𝗿𝗶𝗺𝗲 𝗫𝗕𝗧
Sign up for a new Trading Account on Prime XBT!
Receive a deposit bonus of up to $7,000 with promo code: KyleDoops
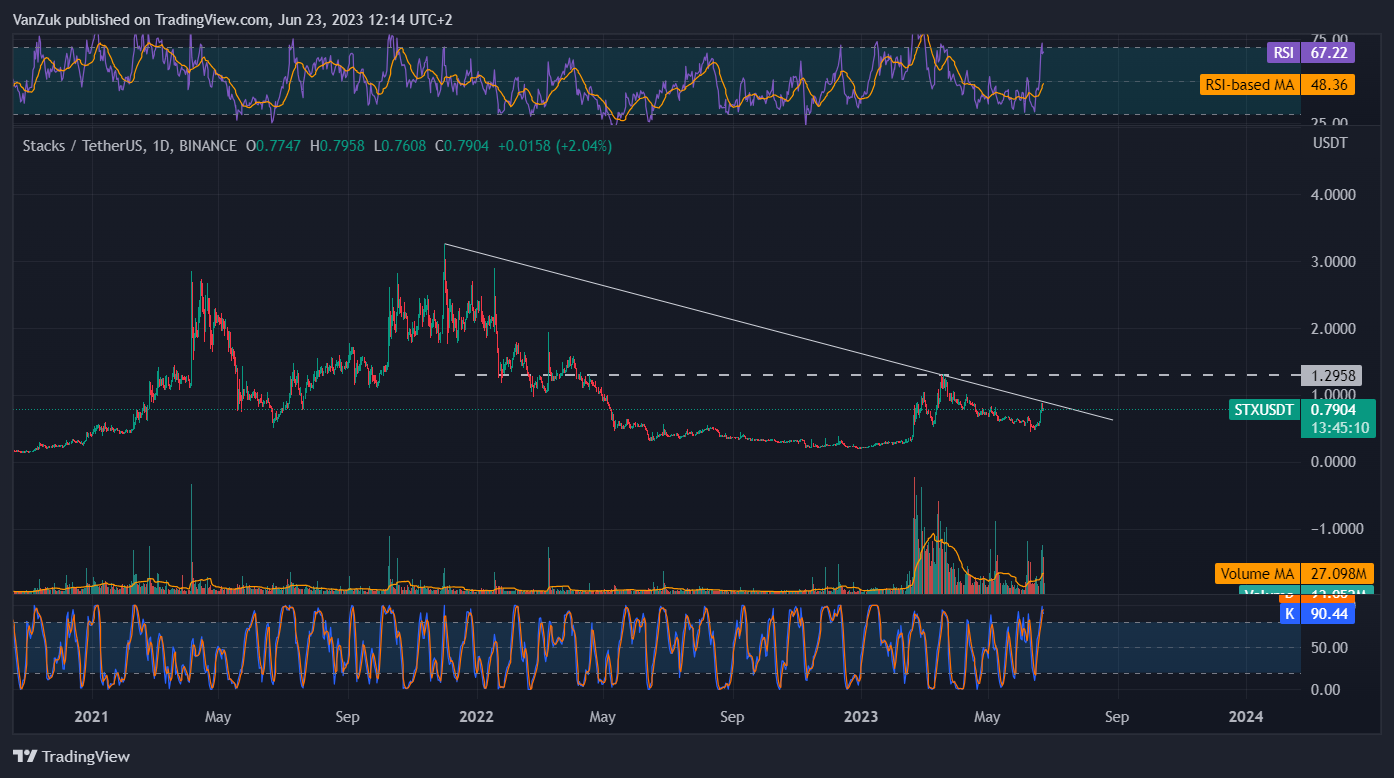
Chart #2 - Stacks (STXUSDT) 1-Day Chart
Chartist: Sheldon
(For the chart screenshot, click here.)
STX has been performing well recently, largely due to the movement of Bitcoin. The correlation is due to the structure of STX, which is built on top of the Bitcoin blockchain. So, as Bitcoin moves, STX tends to move with it.
Looking at the STX chart, it's clear that the coin is nearing the point of breaking a significant long-term trend line dating from November 2021. If STX manages to breach this trend line, I anticipate a retest and then a potential target price of around $1.30.
Sign-up and trade on Bybit today.
Exclusive $30,000 deposit rewards and bonuses up for grabs!

Sign up for a new Trading Account on Prime XBT!
Receive a deposit bonus of up to $7,000 with promo code: SheldonSniper
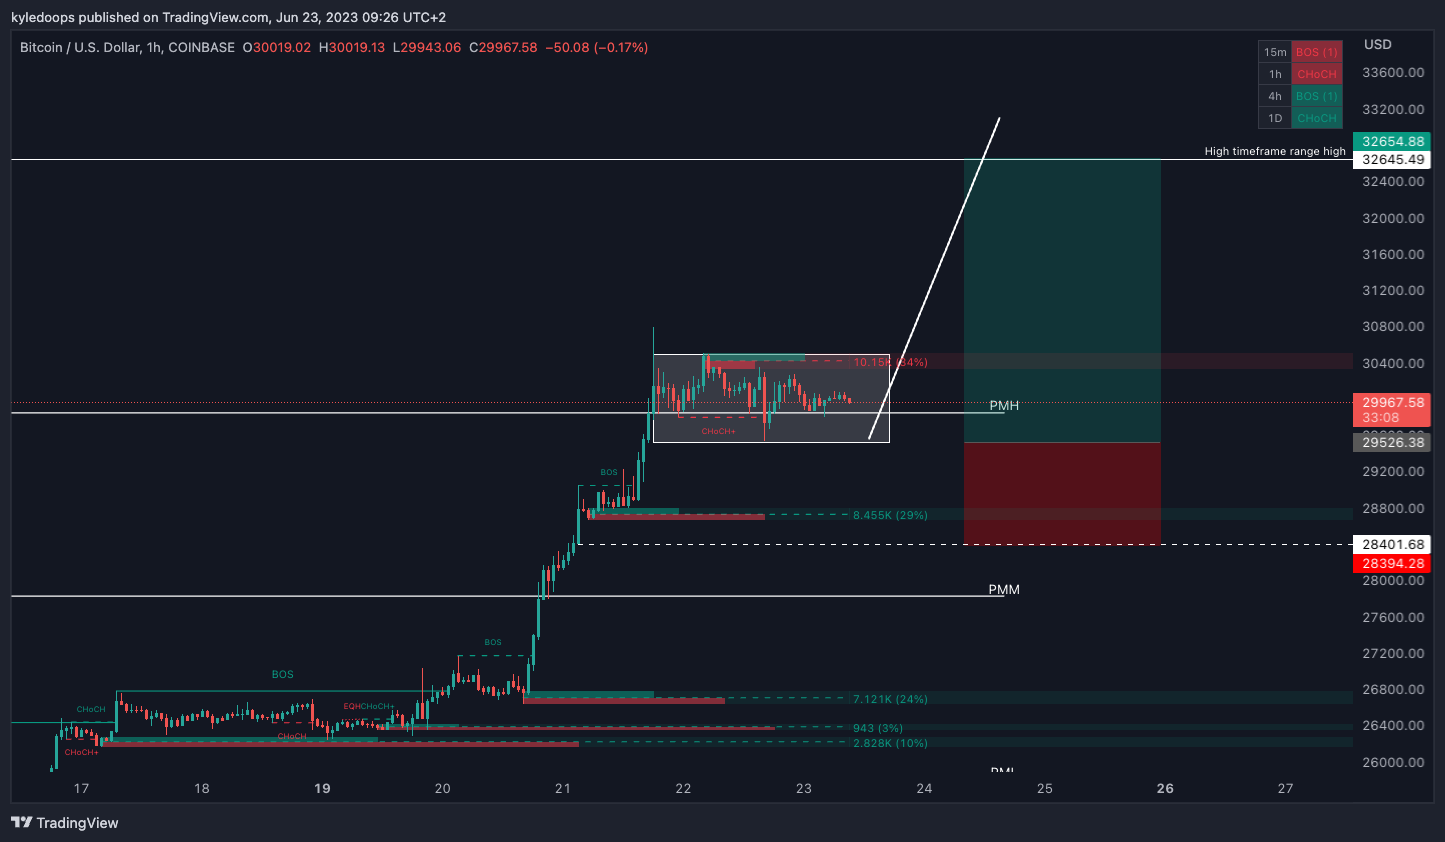
Chart #3 - Bitcoin (BTCUSD) 1-Hour Chart
Chartist: Kyle
(For the chart screenshot, click here.)
BTC is still within a bull flag on the lower timeframe. Watch for a sweep below the flag and a reclaim of the $29,500 mark, as that is your buying opportunity.
If the price exceeds the previous month's high (labeled PMH on the chart), it should give you additional confirmation that the price is likely to surge.
The target for taking profits would be the high timeframe range high at $32,645.
Claim your Bitget sign-up bonuses here (details below).
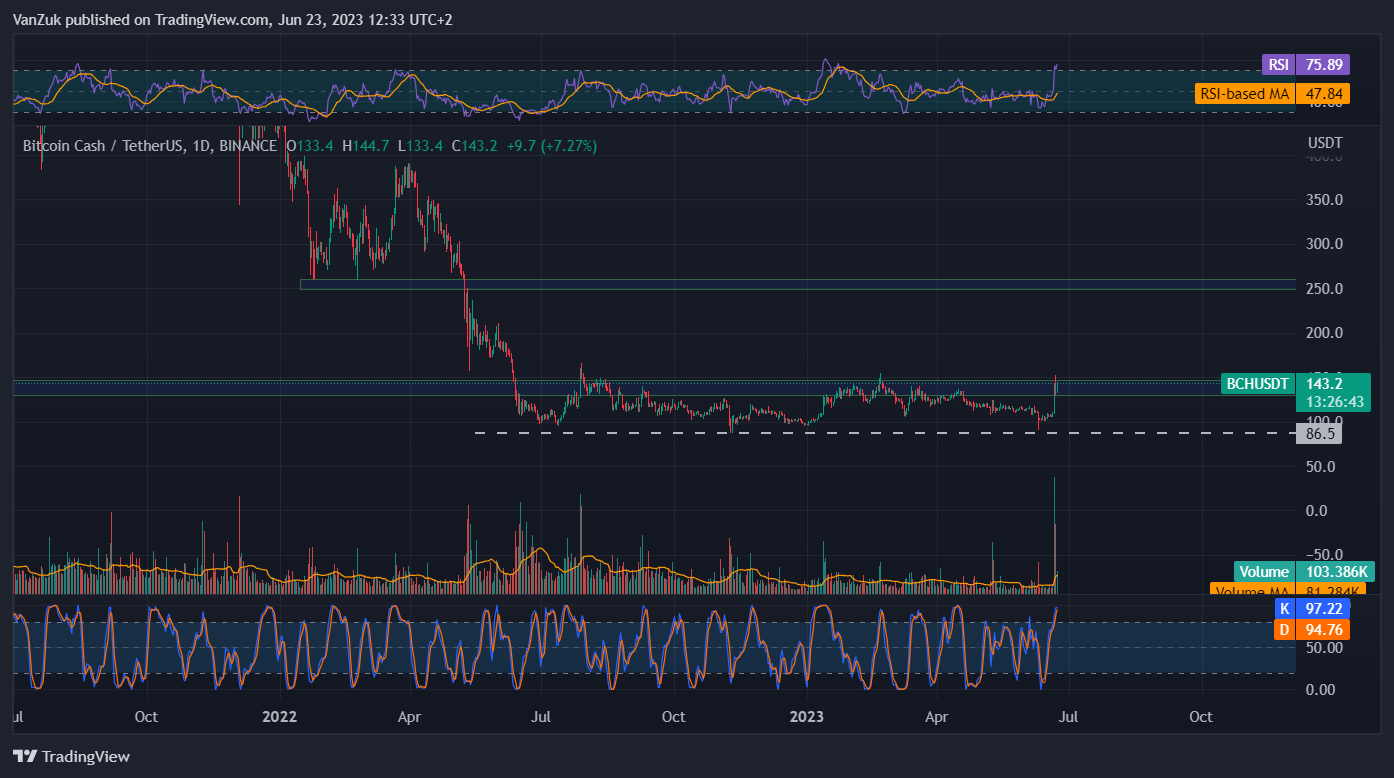
Chart #4 - Bitcoin Cash (BCHUSDT) 1-Day Chart
Chartist: Sheldon
(For the chart screenshot, click here.)
Bitcoin Cash (BCH) has attracted significant interest recently.
BCH has increased about 50% from its recent low and is currently facing a resistance level, as indicated on the chart. If this resistance is breached, BCH could readily rise to the $250 level.
Claim your Bitget sign-up bonuses here (details below).
Chart #5 - Bitcoin Fear and Greed Index
The Bitcoin Fear and Greed Index is sitting at 65 today, indicating Greed.
The highest the index has been over the past seven days is 65, and the lowest is 47.

Banter’s Take
Prices began their rally exactly one week ago.
It's likely we'll see one more upward push before a substantial pullback occurs. Long positions are heavily accumulated in the market, which suggests that after this final surge, they're likely to be flushed out with a significant downward wick.
Stay safe my friends!
Go to our Crypto Banter Discord here where Sheldon and Kyle give updates on the charts and trades from The Daily Candle newsletter!