

📈📉 ETH Breakout on the Horizon: $2,021 In Sight!
📈📉 ETH Breakout on the Horizon: $2,021 In Sight!

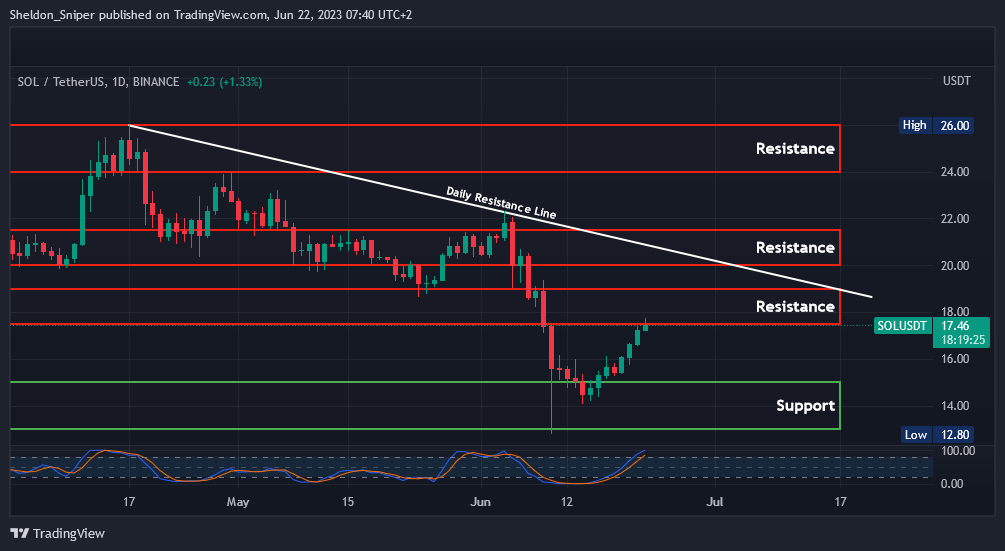
Chart #1 - Solana (SOLUSDT) 1-Day Chart
Chartist: Sheldon
(For the chart screenshot, click here.)
Following the SEC's announcement in early June that SOL was classified as a security, the price plunged from approximately $22 down to $12.80 before finding support.
Over the past week, SOL has recouped most of its losses, with its price hovering around $17.80 earlier today. The price has now hit the first significant resistance zone, which lies between $17.50 - $19.00. A minor correction might occur before SOL attempts to ascend further. Should SOL backtrack from here, a slight support area around $16.00 could become an area of interest.
On the upside, if SOL's price can breach the $19.00 mark, the next resistance area is located between $20 - $21.50. There, the daily descending resistance line, originating from mid-April, may pose an additional obstacle.
Sign-up and trade on Bybit today.
Exclusive $30,000 deposit rewards and bonuses up for grabs!
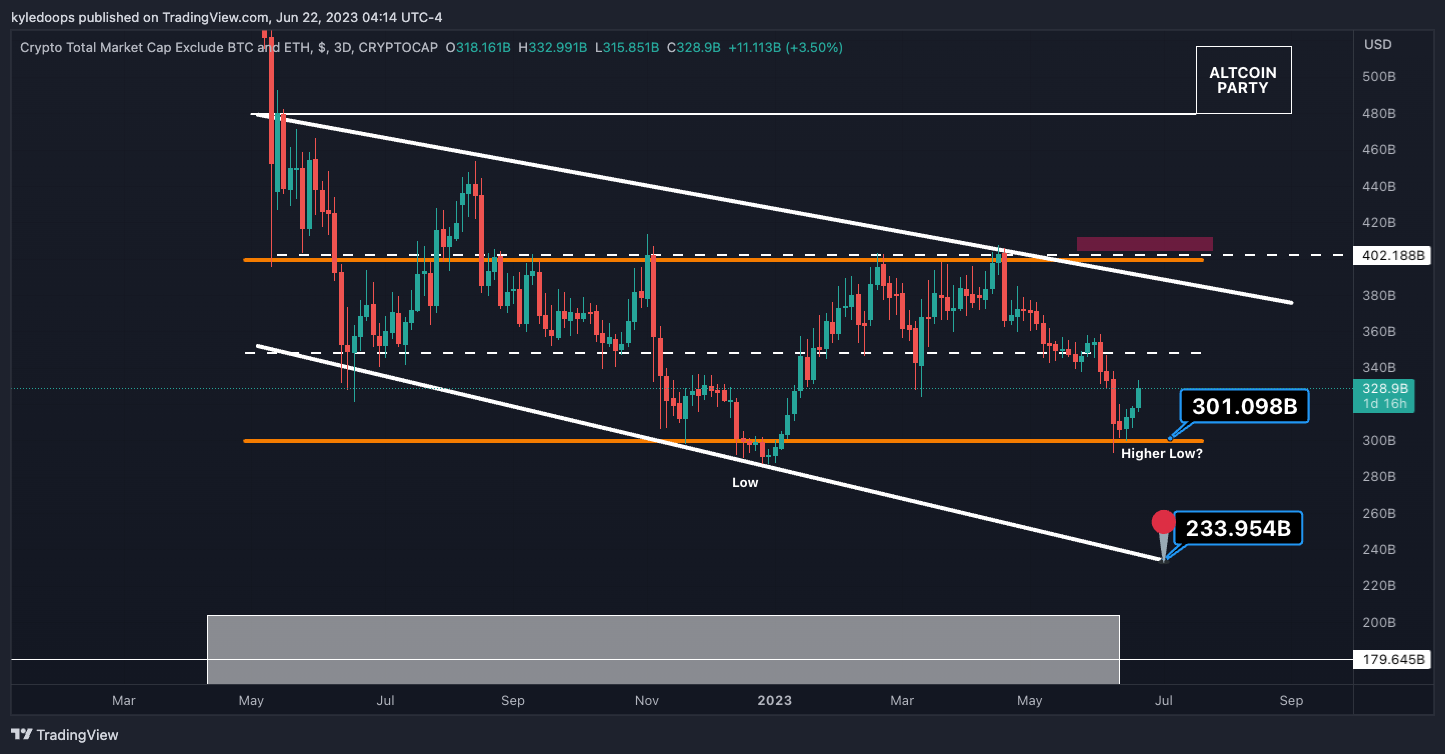
Chart #2 - TOTAL3 3-Day Chart
Chartist: Kyle
(For the chart screenshot, click here.)
The TOTAL3 appears to be forming a higher low from the $301.09 billion level.
The first resistance point is coming in at $348 billion. If the price breaks above that level, the next upside target is $385 billion.
It may be too soon to jump into alts right now, but it's wise to start putting them on our watchlist.
𝗣𝗿𝗶𝗺𝗲 𝗫𝗕𝗧
Sign up for a new Trading Account on Prime XBT!
Receive a deposit bonus of up to $7,000 with promo code: KyleDoops

Sign up for a new Trading Account on Prime XBT!
Receive a deposit bonus of up to $7,000 with promo code: SheldonSniper
Chart #3 - Ethereum (ETHUSD) 1-Week Chart
Chartist: Kyle

(For the chart screenshot, click here.)
If ETH breaks and sustains above the $1,909 level, it will likely begin to accelerate towards the $2,021 level. This means a sweep above the range high could be our next major draw on liquidity.
The range high and low have been determined using the May high and low on the monthly time frame. As seen with Bitcoin, it swept the range low and then the range high. ETH has swept the range low, but has not yet swept the range high.
Yesterday, we analyzed the ETH/BTC chart which indicated signs of a bounce, implying that ETH would rise against BTC. So far, that appears to be the case and could lead to my thesis here being proven right.
Claim your Bitget sign-up bonuses here (details below).
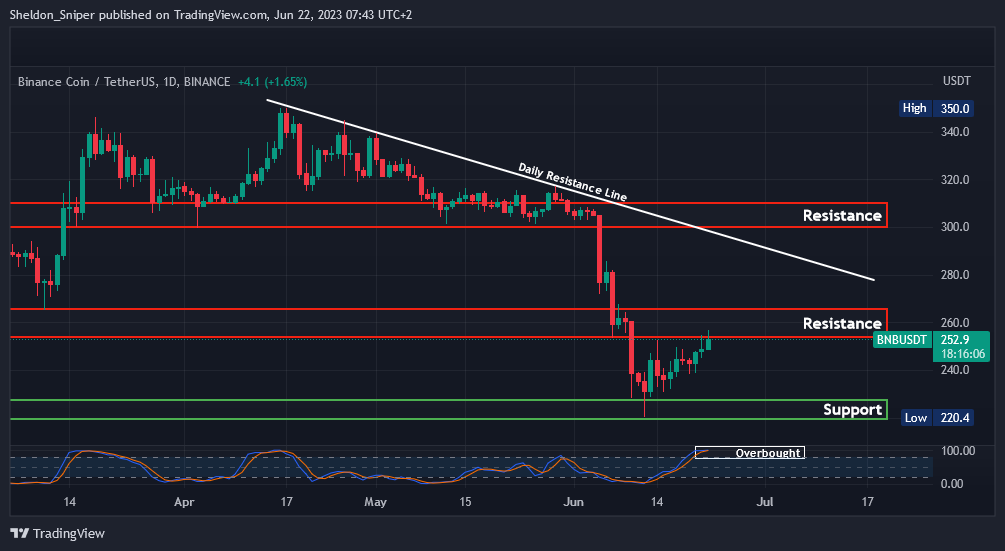
Chart #4 - BNB (BNBUSDT) 1-Day Chart
Chartist: Sheldon
(For the chart screenshot, click here.)
In early June, the SEC announced its intent to charge Binance.US, leading to a significant drop in BNB. As a result, the coin lost its primary support area at $300 and retraced down to $220 before finding support.
Over the past week and a half, the price has rebounded and is now trading around $250.
It has hit the first substantial resistance area at $250 - $265, and is beginning to appear overbought on higher time frames, though it could remain overbought for some time. But if the price is rejected here, a minor retrace may occur, with the first minor support area around $235 - $240 potentially providing an entry point for the price to ascend over the next few weeks.
If the price can break through the $250 - $265 resistance zone, the next resistance point is the daily descending resistance line originating from mid-April, located around $290.
Claim your Bitget sign-up bonuses here (details below).
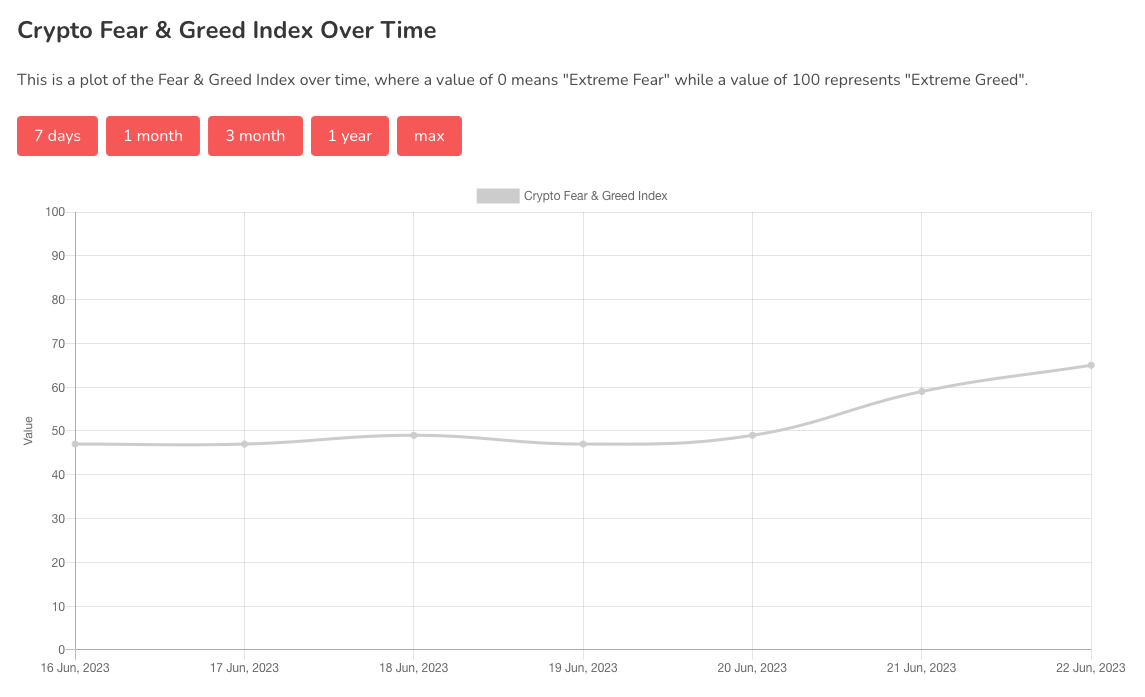
Chart #5 - Bitcoin Fear and Greed Index
The Bitcoin Fear and Greed Index is sitting at 65 today, indicating Greed.
The highest the index has been over the past seven days is 65, and the lowest is 47.
Banter’s Take
Bitcoin had a huge move and now any pullbacks will likely be eaten up, so as long as bulls hold the price above $28,500 there will most likely be a continuation of this move up.
Stay safe my friends!
Go to our Crypto Banter Discord here where Sheldon and Kyle give updates on the charts and trades from The Daily Candle newsletter!