

📈📉 ETH Breakout Today? + SHIB and FTM Looking Bullish!
📈📉 ETH Breakout Today? + SHIB and FTM Looking Bullish!

Overview
Chart #1 - Fantom (FTMUSDT) 8-Hour Chart
Chart #2 - Bitcoin (BTCUSD) 4-Hour Chart
Chart #3 - Ethereum to Bitcoin Ratio (ETHBTC) Daily Chart
Chart #4 - Shiba Inu (SHIBUSDT) Daily Chart
Chart #5 - Fear and Greed Index

Chart #1 - Fantom (FTMUSDT) 8-Hour Chart
Chartist: Sheldon
(For the chart screenshot, click here.)
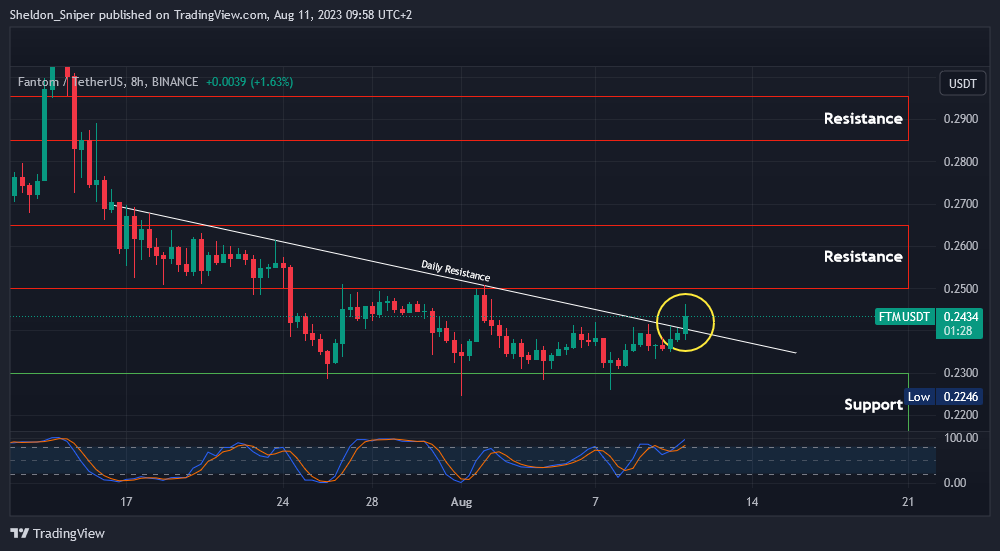
This morning, FTM broke through the four-week daily descending resistance line.
The price currently stands at $0.2430 but could first dip to test the break of the previous daily resistance line - which should now act as support - around $0.24, before potentially moving upward to the $0.25 - $0.2650 resistance area.
If that area is surpassed, the next resistance zone is between $0.2850 - $0.2950.
Sign-up and trade on Bybit today.
Exclusive $30,000 deposit rewards and bonuses up for grabs!
Chart #2 - Bitcoin (BTCUSD) 4-Hour Chart
Chartist: Kyle
(For the chart screenshot, click here.)
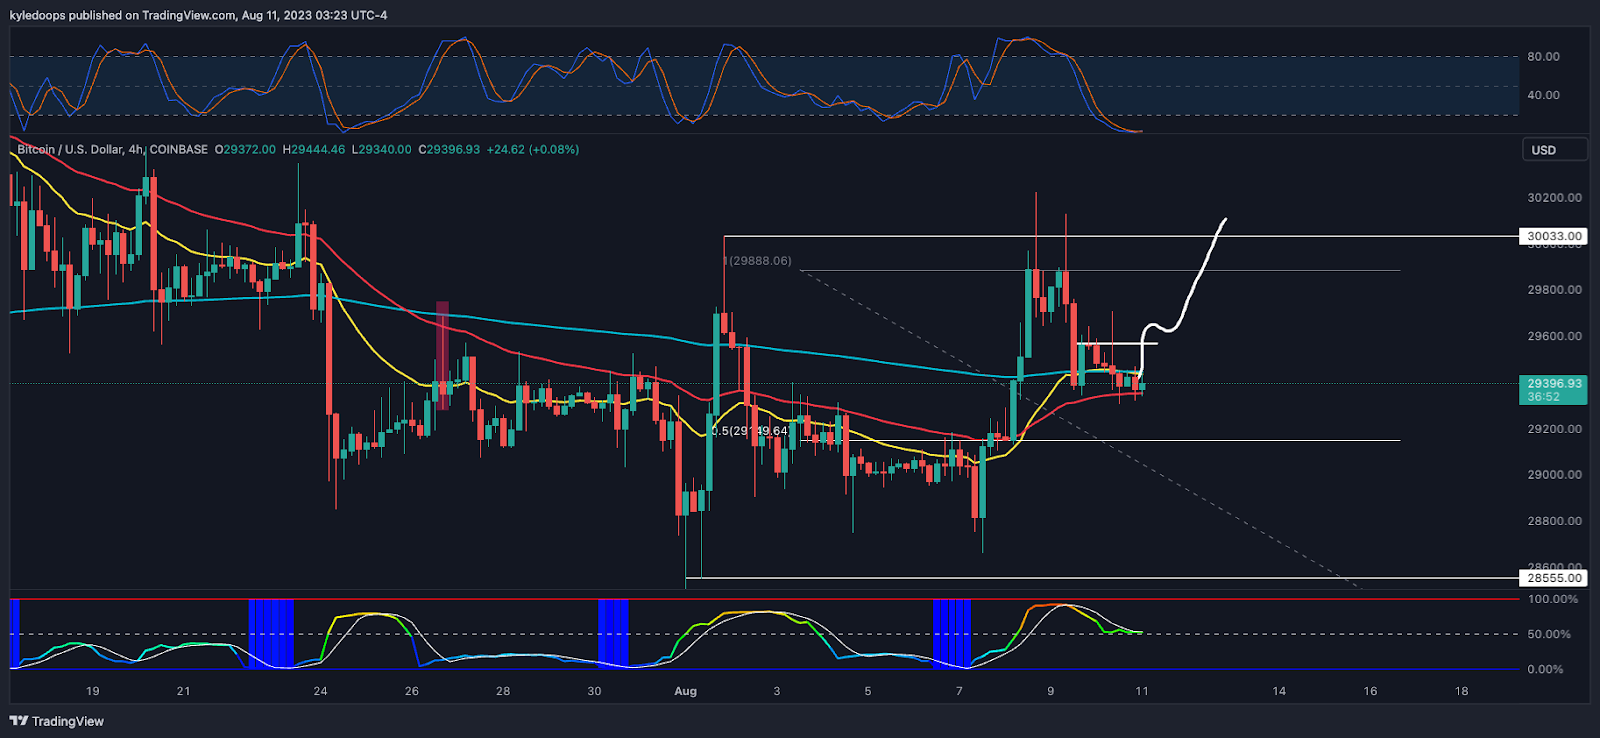
If BTC can reclaim $29,500 and hold there, then we should see a continuation upwards towards $30,033, which is the range high.
BTC had a break of structure with a higher high. Now, we are looking for the higher low, which this could be, as the price is holding at the 50 EMA.
𝗣𝗿𝗶𝗺𝗲 𝗫𝗕𝗧
Sign up for a new Trading Account on Prime XBT!
Receive a deposit bonus of up to $7,000 with promo code: KyleDoops

Sign up for a new Trading Account on Prime XBT!
Receive a deposit bonus of up to $7,000 with promo code: SheldonSniper
Chart #3 - Ethereum to Bitcoin Ratio (ETHBTC) Daily Chart
Chartist: Kyle
(For the chart screenshot, click here.)
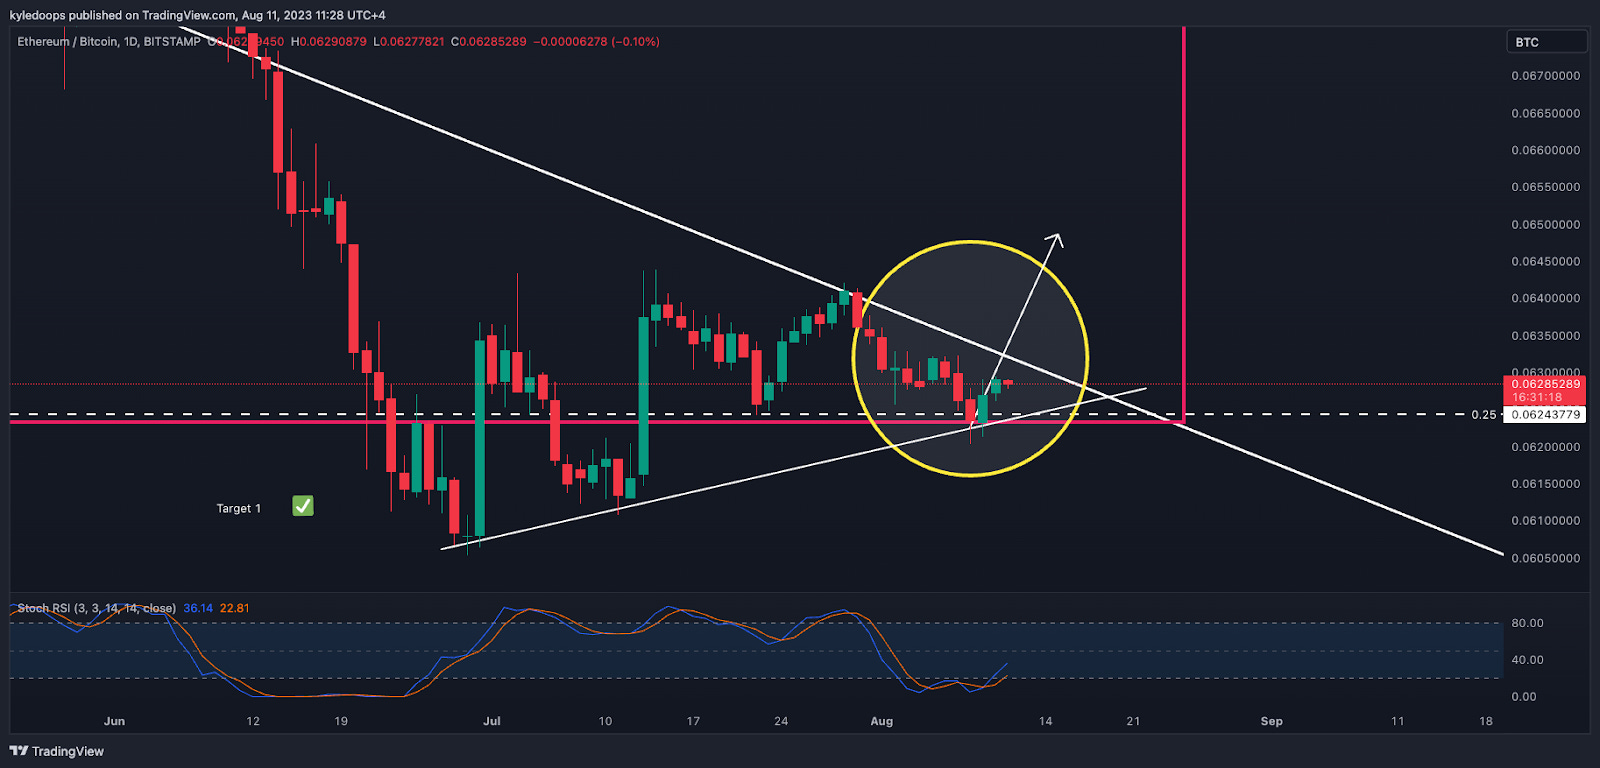
ETH/BTC is pressing hard against resistance.
If it breaks this level, it could truly gain momentum. Looking at the daily candles, the next decisive move will either be today's candle or tomorrow's. This is when it comes into contact with the downward-sloping diagonal trend line, leading to either a rejection or a breakout.
The Stochastic RSI is also turning back up.
Claim your Bitget sign-up bonuses here (details below).
Chart #4 - Shiba Inu (SHIBUSDT) Daily Chart
Chartist: Sheldon
(For the chart screenshot, click here.)
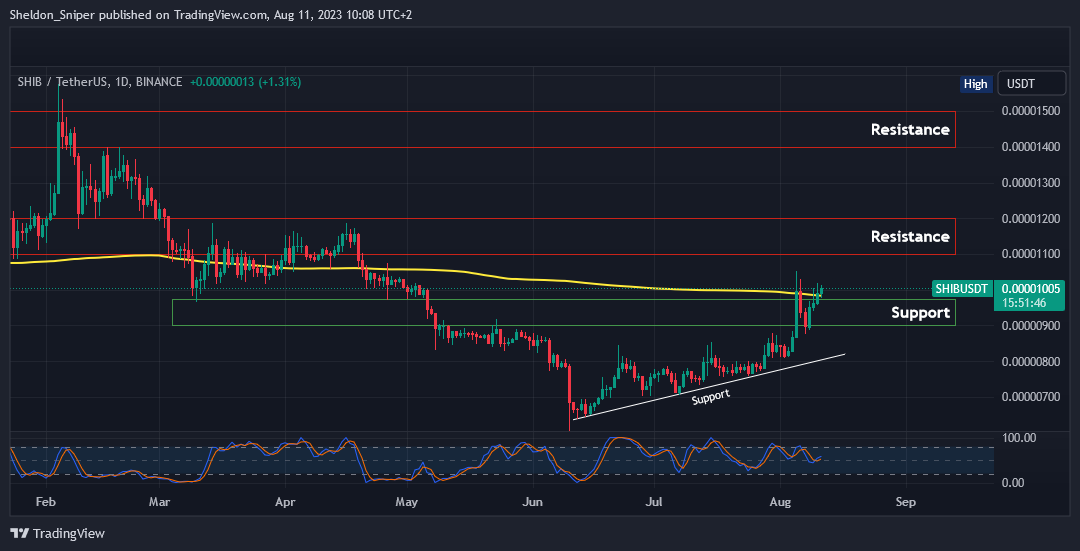
Over the past two days, the price of SHIB has not only breached the $0.000009 - $0.00001 resistance area but also appears to have surpassed the daily 200MA (yellow line). This line had acted as resistance over the last few days.
If the price can maintain its position above the daily 200MA, then it might be gearing up to climb significantly higher. The first target would be the next resistance zone between $0.000011 - $0.000012.
On the downside, the $0.000009 - $0.00001 zone should now serve as major support.
Claim your Bitget sign-up bonuses here (details below).
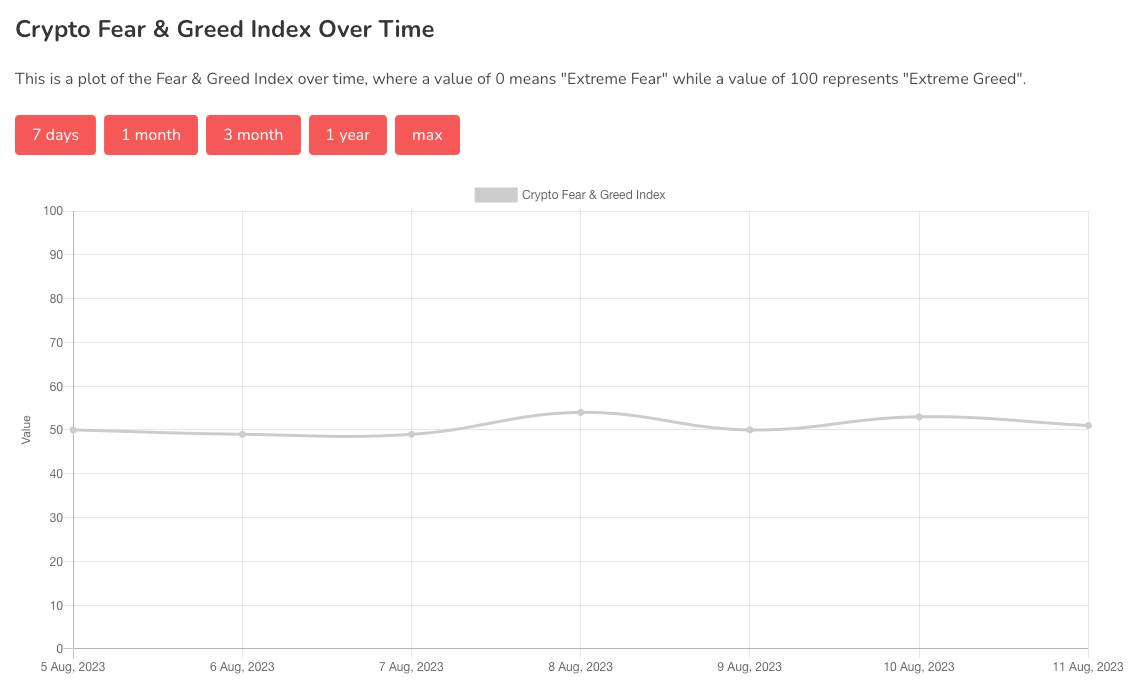
Chart #5 - Fear and Greed Index
The Fear and Greed Index is sitting at 51 today, Neutral.
The highest the index has been over the past seven days is 54, and the lowest is 49.
Banter’s Take
The market might start bouncing back soon. It's the bulls' chance to strike now. If they don't, we'll likely see continued consolidation, and by next week, the bears will have their opportunity once again. The current nature of the market is quite unpredictable. When bulls get a chance and fail to break the price out, the bears regain control.
Stay safe my friends!
Go to our Crypto Banter Discord here where Sheldon and Kyle give updates on the charts and trades from The Daily Candle newsletter!