

📈📉 ETH Could Crash to $2,700!
📈📉 ETH Could Crash to $2,700!
Potential +63% PROFIT on THIS Altcoin!
Overview
Chart #1 - Gala (GALAUSDT) 8-Hour
Chart #2 - Bitcoin (BTCUSD) Weekly
Chart #3 - Ethereum (ETHUSD) Weekly
Chart #4 - Avalanche (AVAX) 8-Hour
Chart #5 - Fear and Greed Index
Caution! There are currently global events that are causing uncertainty and fear in the markets, please manage your risk very tightly at all times.

Enter our draw to Win An ETH in just 30 seconds! Simply:
Subscribe to Crypto Banter’s Good Morning Crypto Newsletter
Invite one friend to subscribe
That’s it! 👇
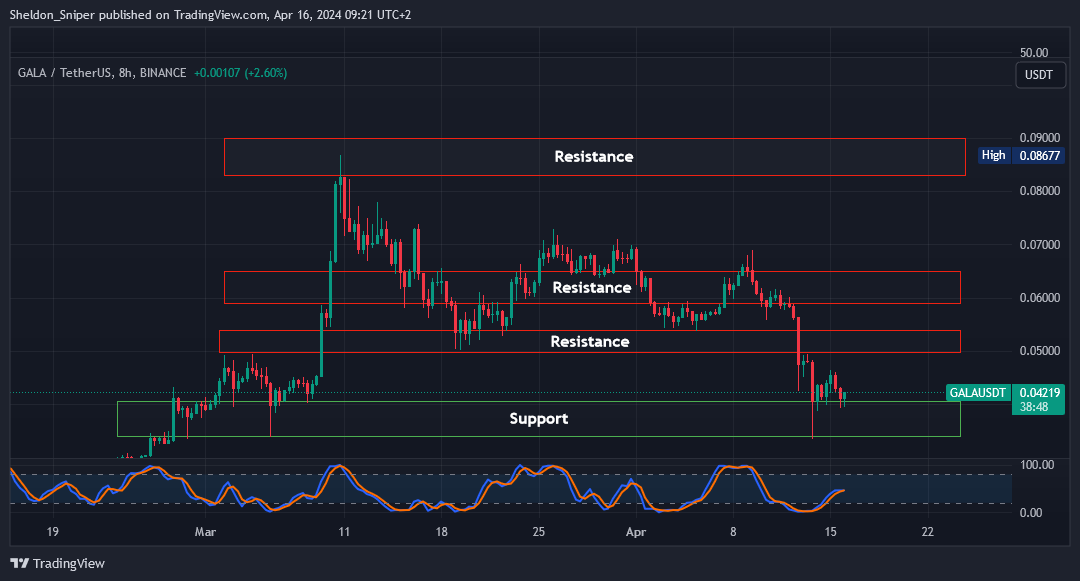
Chart #1 - Gala (GALAUSDT) 8-Hour
Chartist: Sheldon
(For the chart screenshot, click here.)
Like many others, GALA has retraced to support. That means it’s a great level to enter into a long trade:
Entry: Enter into a long spot trade at the current $0.04 level of support
Take Profit (TP)
TP1: $0.05 - $0.054 (25% 35%)
TP2: $0.059 - $0.065 (48% - 63%)
Stop Loss: A tight SL just below $0.039
Sign-up and trade on Bybit today.
Exclusive $30,000 deposit rewards and bonuses up for grabs!
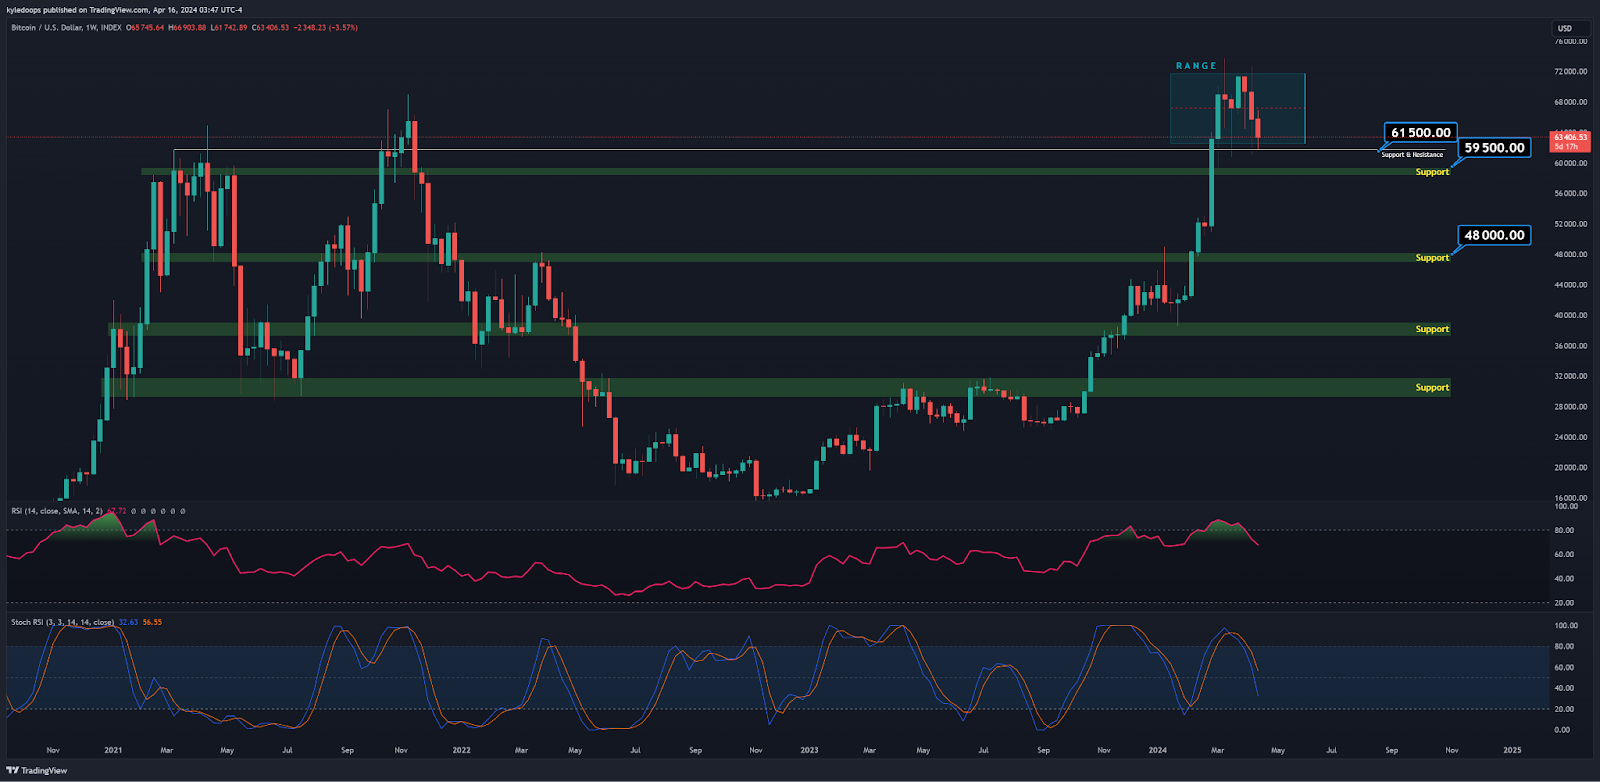
Chart #2 - Bitcoin (BTCUSD) Weekly
Chartist: Kyle
(For the chart screenshot, click here.)
Bitcoin has rejected just above $72,000.
Examining the weekly RSI and Stochastic RSI indicators, both are showing a shift in momentum and signaling a reversal, clearly indicating that we are in a correction phase!
Regarding price action, the bulls have temporarily lost dominance but are holding the price above $62,800. If it drops below $61,500, then the bears may push the prices down to $59,500, $52,000, and even $48,000.
Claim your Bitget sign-up bonuses here (details below).

Outsmart 99% Of The Market!
Get full access into our Discord And Telegram group, where you'll find all of our premium content!
👉 Trade Signals!
👉 Trade Set-Ups!
👉 Trading Challenges!
👉 Education!
👉 SO MUCH MORE!
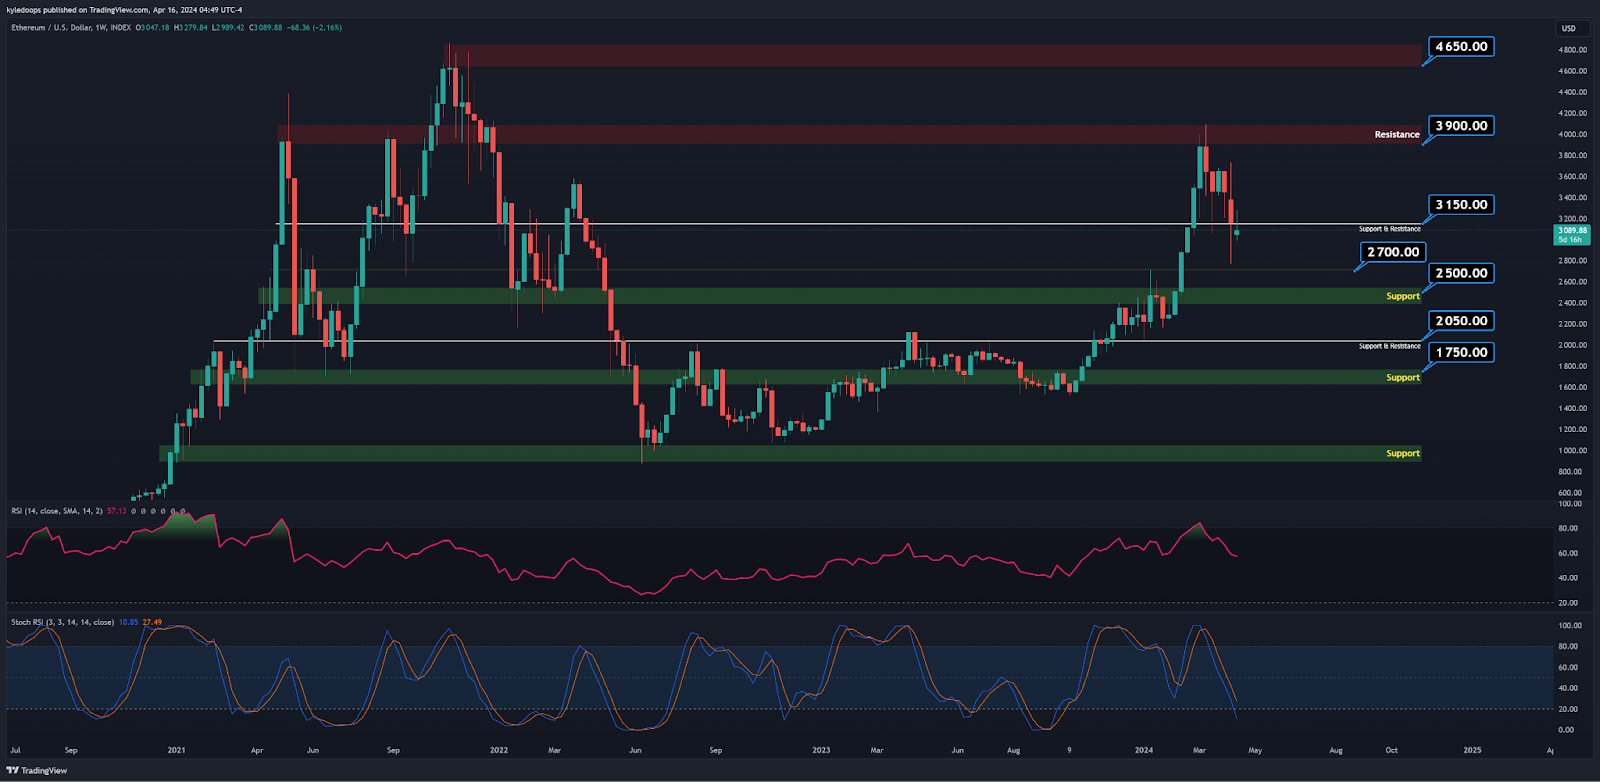
Chart #3 - Ethereum (ETHUSD) Weekly
Chartist: Kyle
(For the chart screenshot, click here.)
ETH is in a correction phase on the weekly chart, having fallen from $4,100 and passed below the support level at $3,150 without recovering.
There is a high possibility that it will target the next flip zone at $2,700.
Claim your Bitget sign-up bonuses here (details below).
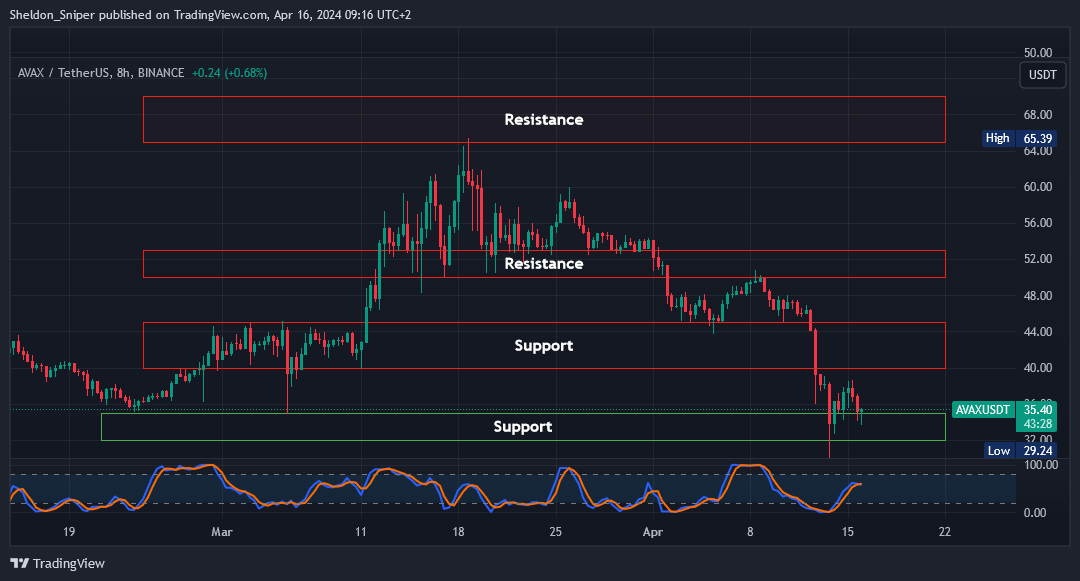
Chart #4 - Avalanche (AVAX) 8-Hour
Chartist: Sheldon
(For the chart screenshot, click here.)
AVAX is another one that is at support so we have a clear area to enter a trade:
Entry: $34.00 - $35.00
Take Profit (TP):
TP1: $40.00 - $45.00 (18% - 32%)
TP2: $50.00 - $53.00 (47% - 56%)
Stop Loss: A tight stop loss just below $33.00
Claim your Bitget sign-up bonuses here (details below).
BTC at a Crossroads: Navigating Market Uncertainty with a Call Ratio Spread Strategy: With Deribit’s Anand
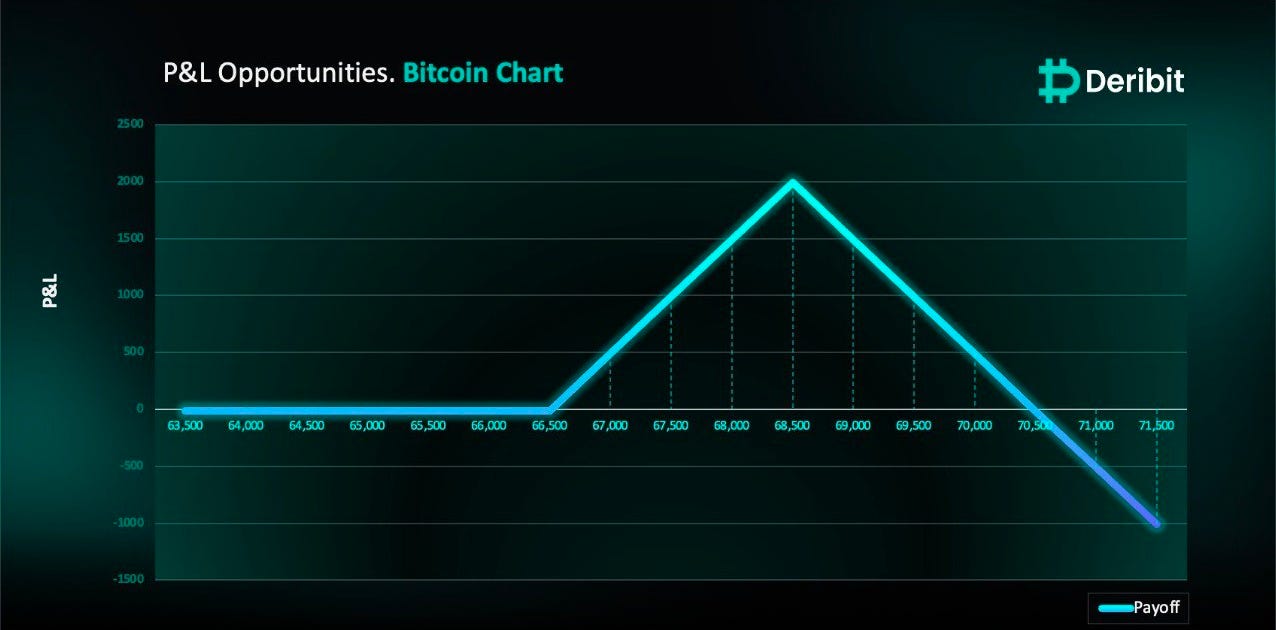
BTC hasn’t shown a strong upward momentum after reaching the 4H demand zone, instead, it’s retracing from the 4H supply zone. Additionally, the BTC ETF’s flow data doesn’t look promising. Given these factors, my stance is neutral with a slight bullish inclination because the 4H demand zone is still intact. Traders interested in capitalizing on this perspective might consider employing a call ratio spread strategy.
Trade Structure
(OTM Call) Buy 1x BTC-19APR24-$66,500-C @ $550
(OTM Call) Sell 2x BTC-19APR24-$68,500-C @ $270
Payouts
Maximum Profit: $1,990/BTC
Net Debit of Strategy: $10/BTC
If Bitcoin is at $68,500 when the options expire on April 19, traders will be at maximum profit from the strategy.
Get set up with Deribit here.
Banter’s Take
A liquidity pool has been forming and building up at $64,000 due to short orders. People are uncertain about which direction to look, especially after the recent news that Hong Kong has approved BTC and ETH ETFs. Yet, we see the same reaction: neither Bitcoin nor Ethereum moved upwards. We advise caution and recommend preparing for the expected correction.
Stay safe my friends!
Go to our Crypto Banter Discord here where Sheldon and Kyle give updates on the charts and trades from The Daily Candle newsletter!