

📈📉 ETH EXTREMELY Bullish! Render Trade Entry Spotted at…
📈📉 ETH EXTREMELY Bullish! Render Trade Entry Spotted at…

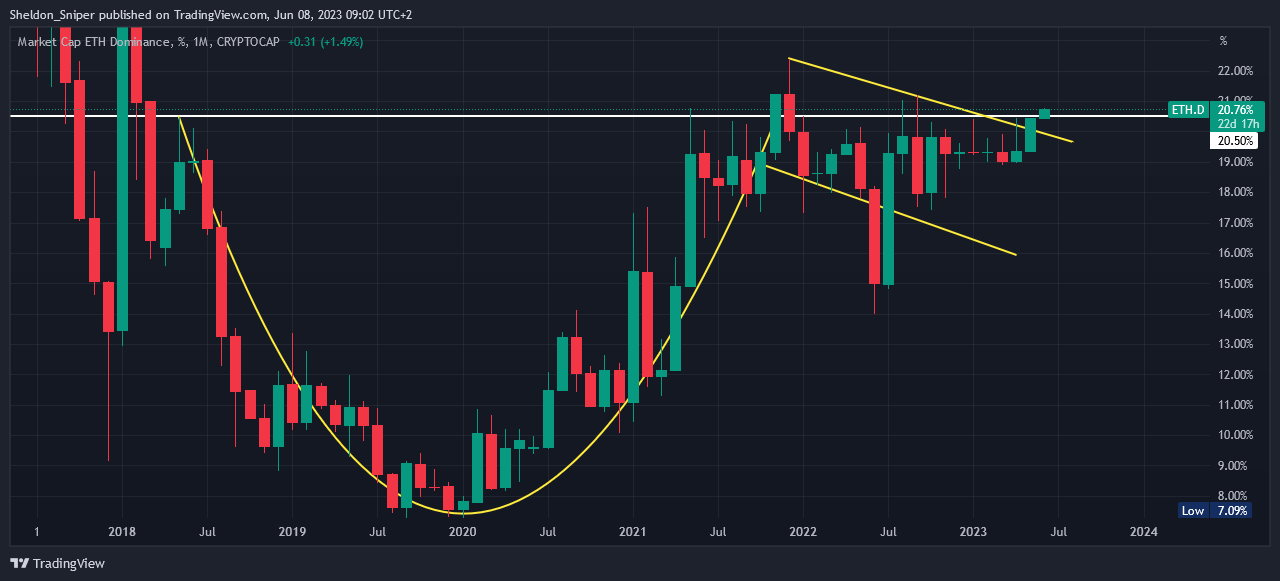
Chart #1 - Ethereum Dominance (ETH.D) 1-Month Chart
Chartist: Sheldon
(For the chart screenshot, click here.)
We currently see Ethereum Dominance attempting to breach a key monthly resistance level not breached in over 5 years!
And now that I have your attention…
This comes after this week's sell-off for many coins that the SEC has identified as securities, while ETH stands strong. The 20.5% level has served as significant resistance for the past five and a half years, during which time ETH.D has formed a gigantic bullish Cup and Handle structure.
There have been several attempts by ETH.D to breach the 20.5% level over the past two years, but all have been rejected. However, we now see that, with ETH maintaining a price level of around $1,800 while the general market is declining, ETH.D is once again trying to surpass the critical 20.5% level.
A positive breach of this level over the upcoming weeks could propel the dominance to the next resistance level of 25%, a level last seen in 2017.
Sign-up and trade on Bybit today.
Exclusive $30,000 deposit rewards and bonuses up for grabs!
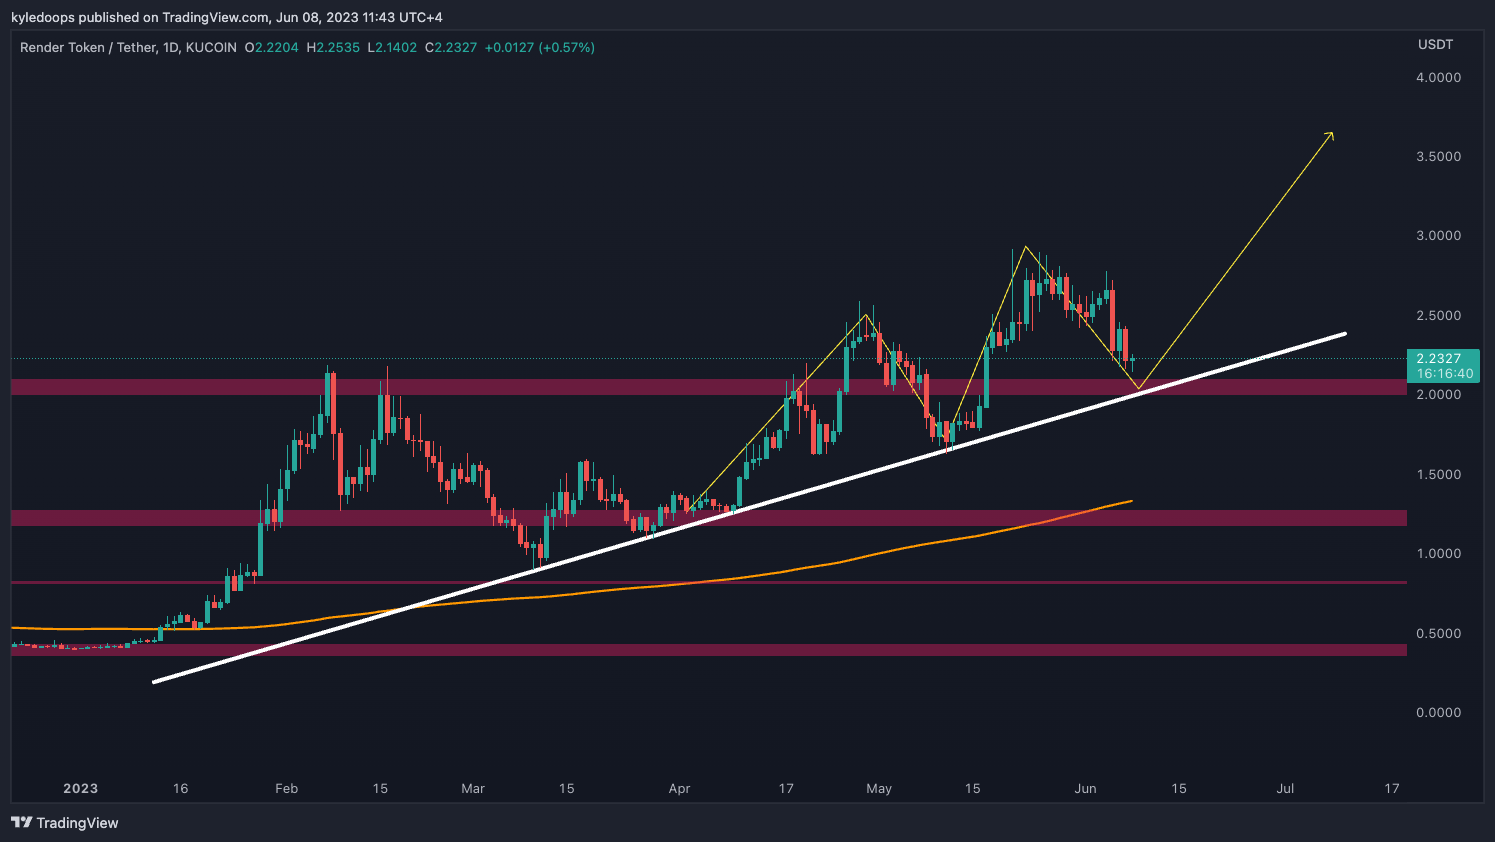
Chart #2 - Render (RENDERUSDT) 1-Day Chart
Chartist: Kyle
(For the chart screenshot, click here.)
Among the few altcoins holding up nicely, RNDR continues to maintain an uptrend.
It has broken out of the range, and this could be a retest not only of the range high at $2, but also of the long-term diagonal trend line. A bounce off this level could open the door for a long opportunity.
However, a break below that trend line would signify reentry into the range, which could be highly bearish.
𝗣𝗿𝗶𝗺𝗲 𝗫𝗕𝗧
Sign up for a new Trading Account on Prime XBT!
Receive a deposit bonus of up to $7,000 with promo code: KyleDoops

Sign up for a new Trading Account on Prime XBT!
Receive a deposit bonus of up to $7,000 with promo code: SheldonSniper
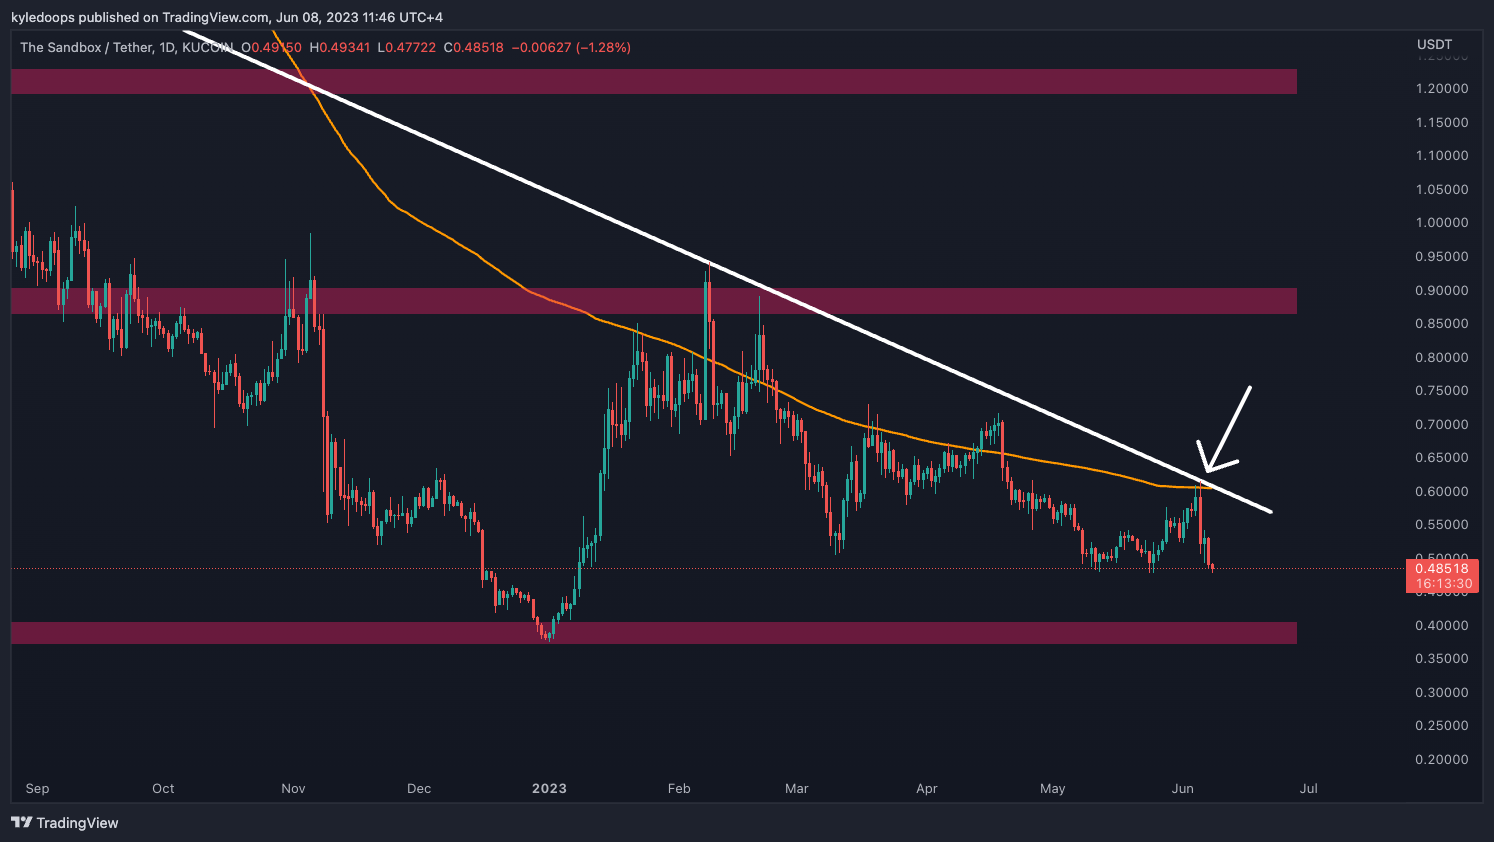
Chart #3 - The Sandbox (SANDUSDT) 1-Day Chart
Chartist: Kyle
(For the chart screenshot, click here.)
SAND is trending towards its range low at 37 cents.
A rejection from the diagonal as well as the 200-day MA, reinforces that an eventual return to the range low is highly likely.
Once it reaches the range low, we would then see if there is a reaction indicating a potential bounce.
Claim your Bitget sign-up bonuses here (details below).
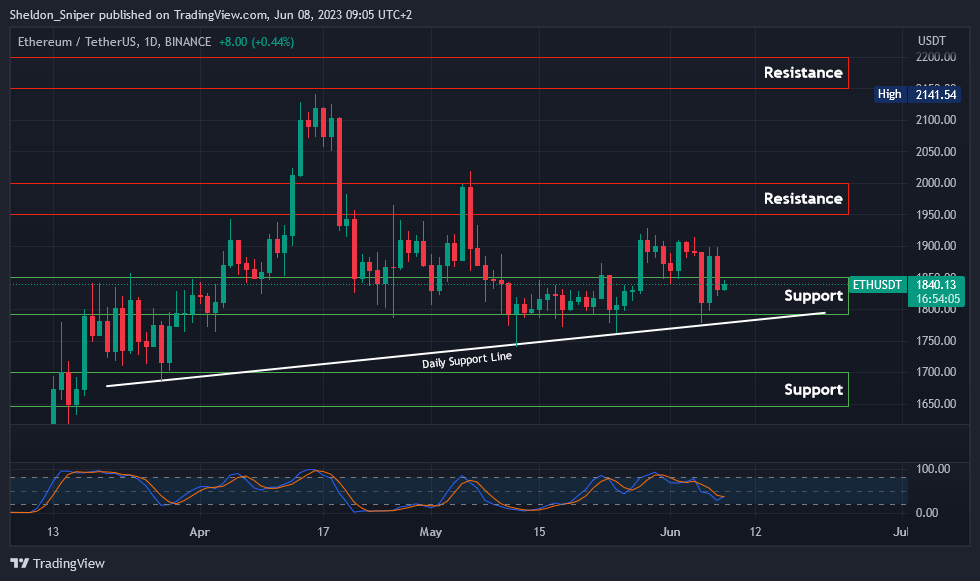
Chart #4 - Ethereum (ETHUSDT) 1-Day Chart
Chartist: Sheldon
(For the chart screenshot, click here.)
Following this week's announcement that the SEC is targeting many coins available for trade on Binance.US, we have seen a market sell-off, particularly affecting those coins on the list.
But ETH - which was never mentioned in the SEC lawsuits - seems to be weathering the current conditions quite well. With ETH dominance potentially breaking key monthly resistance levels, there might be a shift in capital outflow from other coins into ETH.
Over the past two months, the $1,800 - $1,850 range has provided robust support for ETH. If the price can once again break through the $1,850 level, we might see another run-up to test the $1,950 - $2,000 resistance zone. But, if the Total Crypto Market Cap loses key support levels and declines from here, it could potentially drag ETH down with it. To the downside, if both the $1,800 level and daily ascending support line are breached, then the next support is at the $1,650 - $1,700 range.
Claim your Bitget sign-up bonuses here (details below).
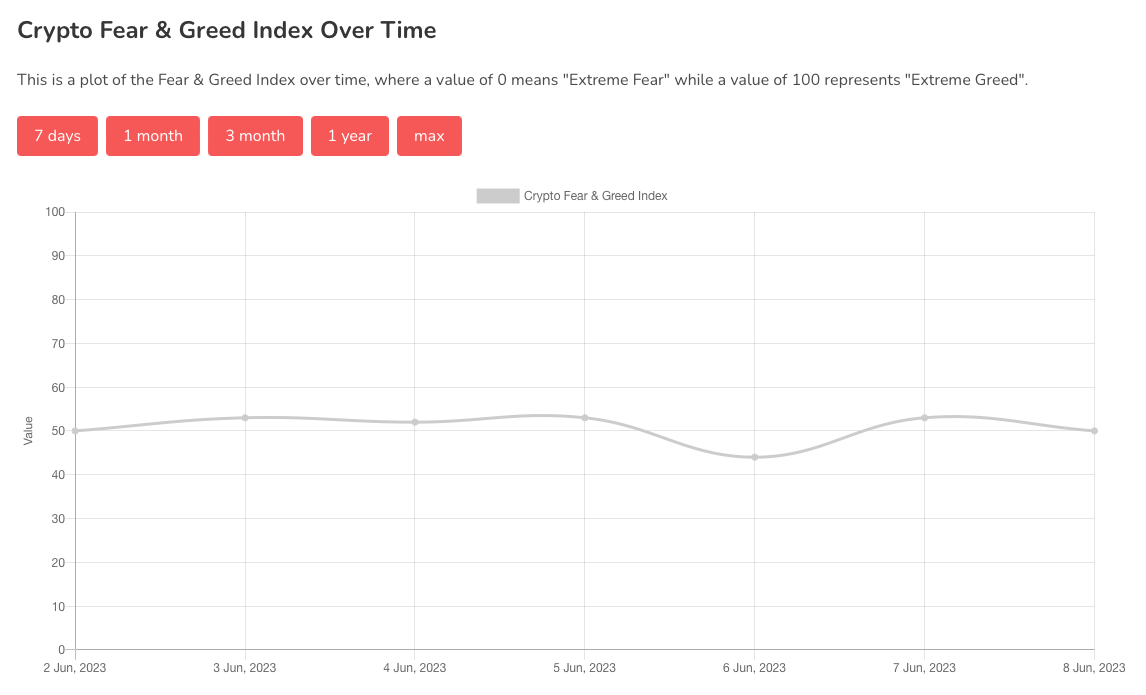
Chart #5 - Bitcoin Fear and Greed Index
The Bitcoin Fear and Greed Index is sitting at 50 today, Neutral.
The highest the index has been over the past seven days is 53, and the lowest is 44.
Banter’s Take
The altcoin market is getting obliterated and many alts are already making new lows. For the coins which haven't, they look set to revisit their lows.
Bitcoin’s main pivot level remains at $26,500. Anything below that is short term bearish, and above it is short term bullish.
Stay safe my friends!
Go to our Crypto Banter Discord here where Sheldon and Kyle give updates on the charts and trades from The Daily Candle newsletter!