

📈📉 ETH Forms Golden Cross! Buy Zone Identified!
📈📉 ETH Forms Golden Cross! Buy Zone Identified!

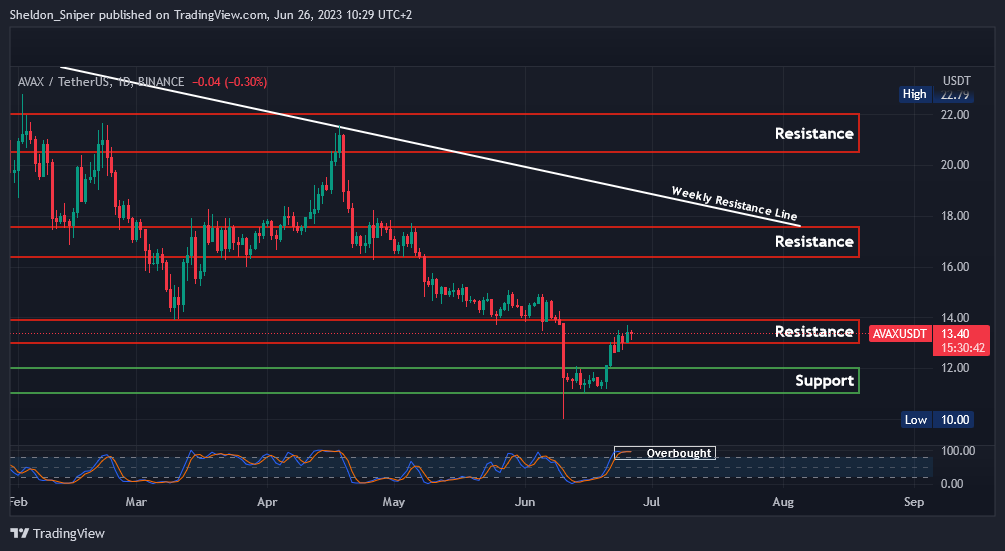
Chart #1 - Avalanche (AVAXUSDT) 1-Day Chart
Chartist: Sheldon
(For the chart screenshot, click here.)
Over the past week, AVAX has rallied from around $11.00 to the current price of $13.50.
At this point, the price has now entered its first area of resistance, which lies between $13.00 - $14.00.
The price is also overbought on higher time frames, so it could either decelerate and range within this current area of resistance, or there's a possibility of a deeper retrace down to test lower support levels, with the first one at $12.00.
However, if the price continues its upward trend from here, the next major area of resistance stands at $16.20 - $17.80.
Sign-up and trade on Bybit today.
Exclusive $30,000 deposit rewards and bonuses up for grabs!
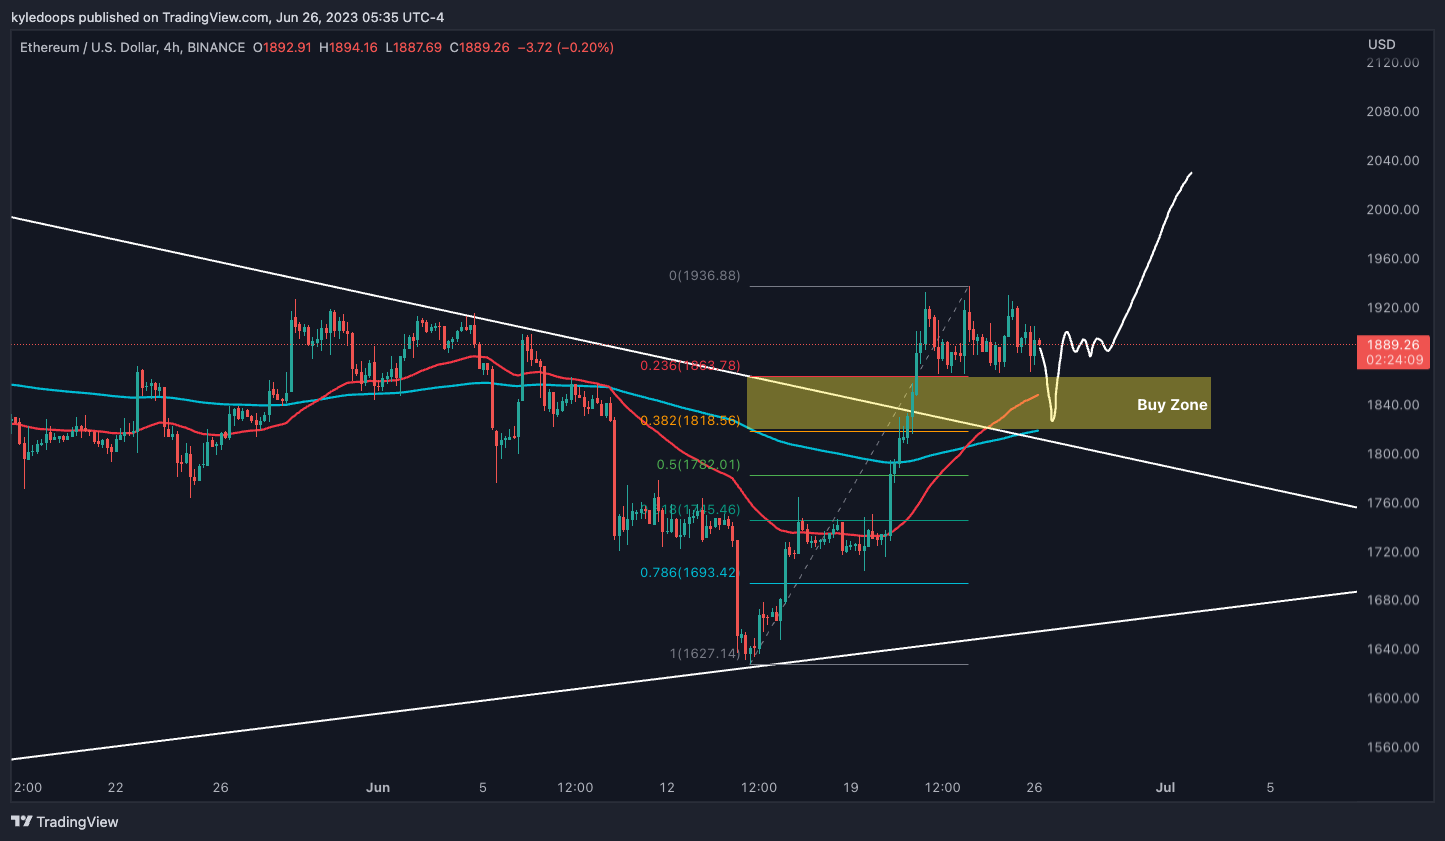
Chart #2 - Ethereum (ETHUSD) 4-Hour Chart
Chartist: Kyle
(For the chart screenshot, click here.)
ETH has just formed a golden cross on the 4-hour timeframe between the 50 and 200 EMA.
Any pullback into the outlined buy-zone ($1,820), which is at the 0.382 FIB retracement level, would present a great buying opportunity.
Subsequently, we should look for a push above the prior month's high, which stands at $2,020.
𝗣𝗿𝗶𝗺𝗲 𝗫𝗕𝗧
Sign up for a new Trading Account on Prime XBT!
Receive a deposit bonus of up to $7,000 with promo code: KyleDoops

Sign up for a new Trading Account on Prime XBT!
Receive a deposit bonus of up to $7,000 with promo code: SheldonSniper
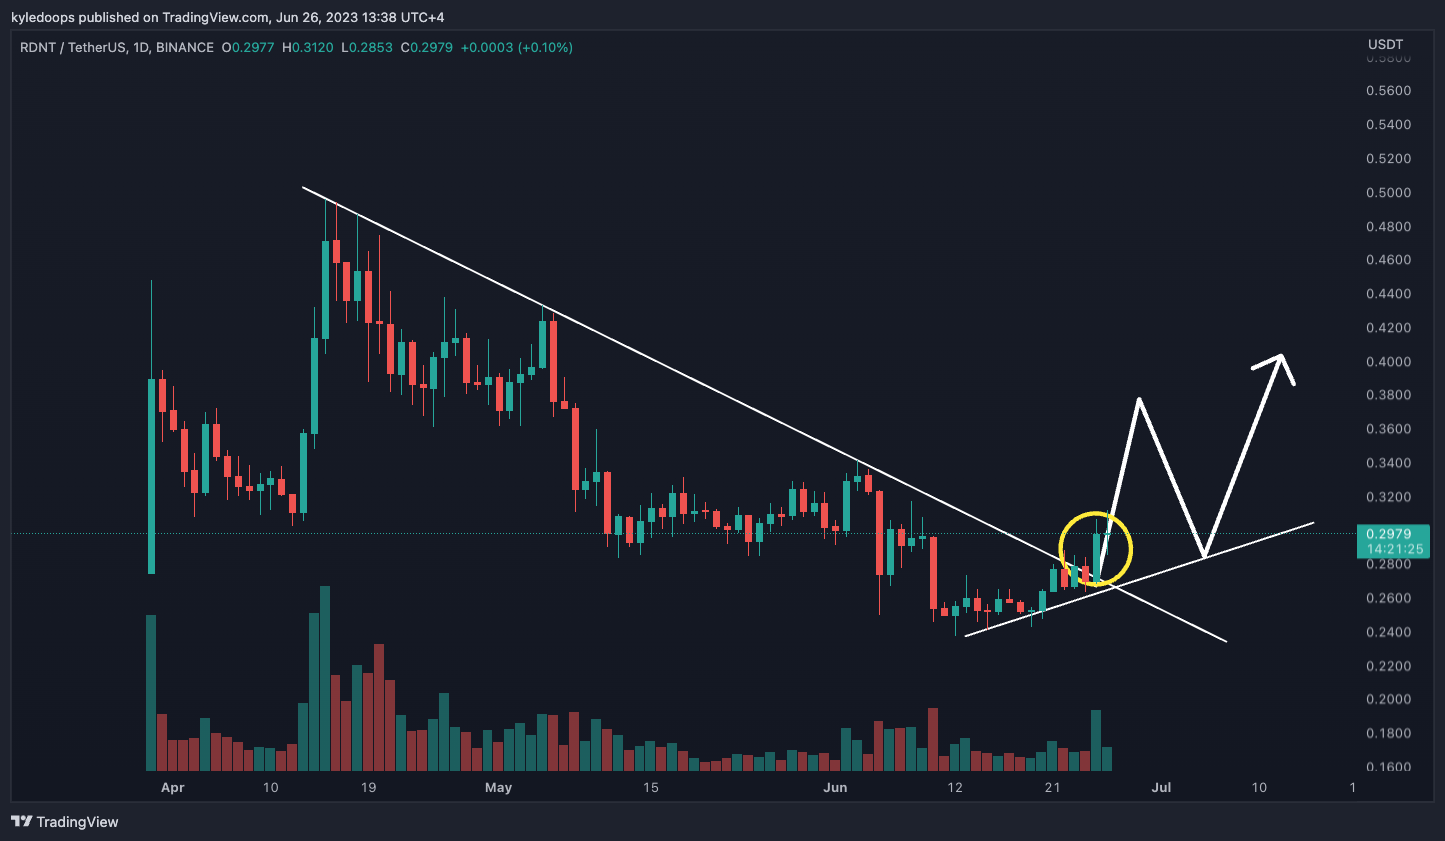
Chart #3 - Radiant Capital (RDNTUSDT) 1-Day Chart
Chartist: Kyle
(For the chart screenshot, click here.)
RDNT has broken a very long-term downsloping trend line, which could lead to a structural break by creating a higher high above $0.341.
A break above this level will mark the first higher high. The subsequent pullback to form the next higher low would be the opportune moment to buy.
If we see this as a breakout trade right now, it would be advisable to set our stop loss under yesterday's low, specifically at $0.2612. If the price falls below that point, it can be interpreted as a failed breakout, likely leading to a lower low.
Claim your Bitget sign-up bonuses here (details below).
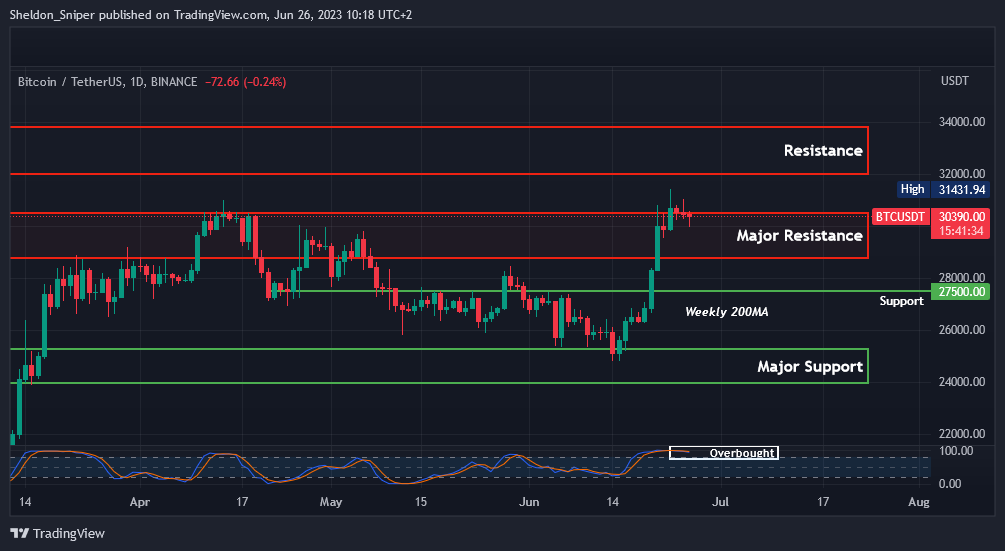
Chart #4 - Bitcoin (BTCUSDT) 1-Day Chart
Chartist: Sheldon
(For the chart screenshot, click here.)
Bitcoin has experienced a significant 25% rally over the last two weeks, and the price has now begun to cool off.
It is currently trading at around $30,400 and is also fluctuating within the $29,000 - $30,500 major area of resistance. It's important to note that the price is also overbought on higher timeframes and could either range within this area of resistance or undergo a deeper pullback to test the next support at $27,500. The weekly 200 Moving Average, sitting below that at $26,500, could also offer additional support.
It's worth noting that a slight correction can be very bullish for the price of BTC, possibly setting it up to move even higher over the following weeks. If the price maintains its uptrend from here, the next major area of resistance lies between $32,000 - $34,000.
Claim your Bitget sign-up bonuses here (details below).
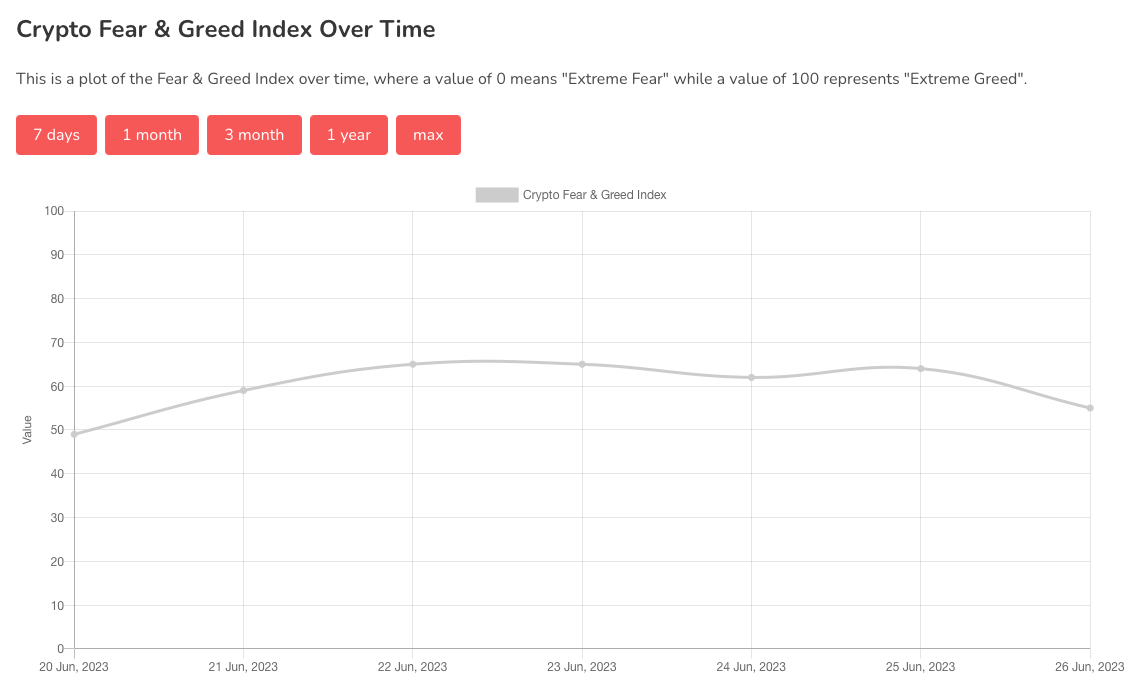
Chart #5 - Bitcoin Fear and Greed Index
The Bitcoin Fear and Greed Index is sitting at 55 today, indicating Greed.
The highest the index has been over the past seven days is 65, and the lowest is 49.
Banter’s Take
The market is currently consolidating after a significant upward move, which is expected. As long as there is no major pullback and the consolidation continues, the probability of another substantial upward movement remains high. The period of consolidation allows the moving averages and momentum oscillators to catch up with the price and reset.
Stay safe my friends!
Go to our Crypto Banter Discord here where Sheldon and Kyle give updates on the charts and trades from The Daily Candle newsletter!