

📈📉 ETH is in TROUBLE!
📈📉 ETH is in TROUBLE!
PLUS: THETA and BNB Also Going DOWN?
Overview
Chart #1 - Solana (SOLUSDT) 12-Hour
Chart #2 - BNB (BNBUSDT) Daily
Chart #3 - Ethereum (ETHUSD) Weekly
Chart #4 - Theta Network (THETAUSDT) 12-Hour
Chart #5 - Fear and Greed Index
Chart #1 - Solana (SOLUSDT) 12-Hour
Chartist: Sheldon
(For the chart screenshot, click here.)
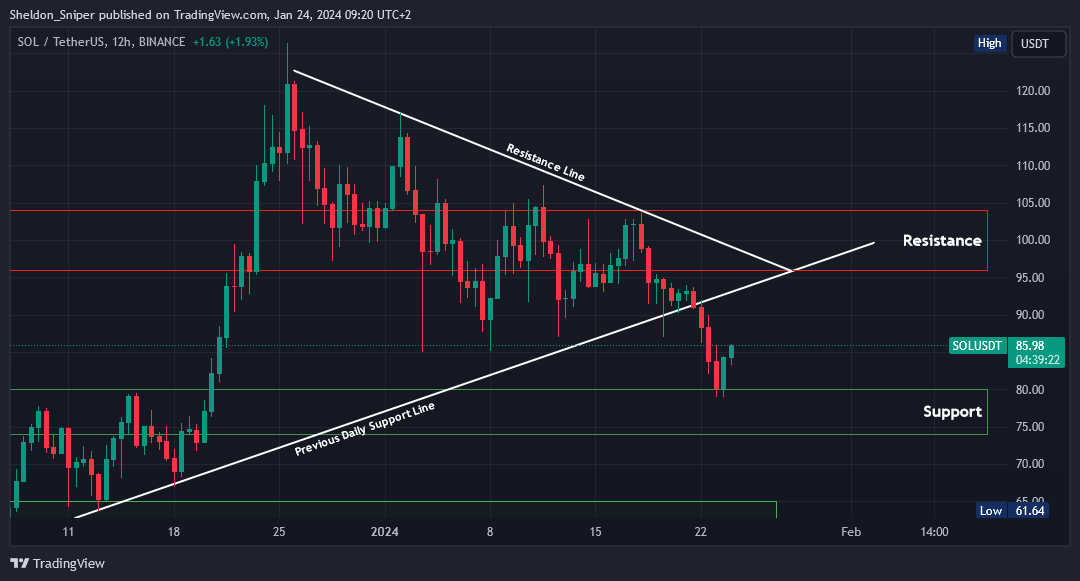
Yesterday, SOL managed to find support just below $80.00 before reversing from that level. Currently, it is trading at $86.00.
Essentially, a few days ago, SOL broke through the daily support line dating back to November last year. The price is now either going up to test the break of that support line and the next major resistance area of $96.00 - $104.00.
Otherwise a rejection in that area could possibly signal another leg down, even possibly testing the $60 - $65 area.
I personally don't think the drop is over yet. The market is currently in a relief rally to test the next areas of resistance before further downside.
Sign-up and trade on Bybit today.
Exclusive $30,000 deposit rewards and bonuses up for grabs!
Chart #2 - BNB (BNBUSDT) Daily
Chartist: Kyle

(For the chart screenshot, click here.)
BNB keeps retracing since late December, and it's very likely that it will target the Imbalance Zone from $285 to $269.
The major support level is the $230 area, and it's unlikely to see it pass that point at the current state. Shorts are more likely to play out from this point.
As of today, to have a strong conviction for longs, BNB needs to clear the previous high at $339 and stay above.
Claim your Bitget sign-up bonuses here (details below).

Outsmart 99% Of The Market!
Get full access into our Discord And Telegram group, where you'll find all of our premium content!
👉 Trade Signals!
👉 Trade Set-Ups!
👉 Trading Challenges!
👉 Education!
👉 SO MUCH MORE!
Chart #3 - Ethereum (ETHUSD) Weekly
Chartist: Kyle
(For the chart screenshot, click here.)
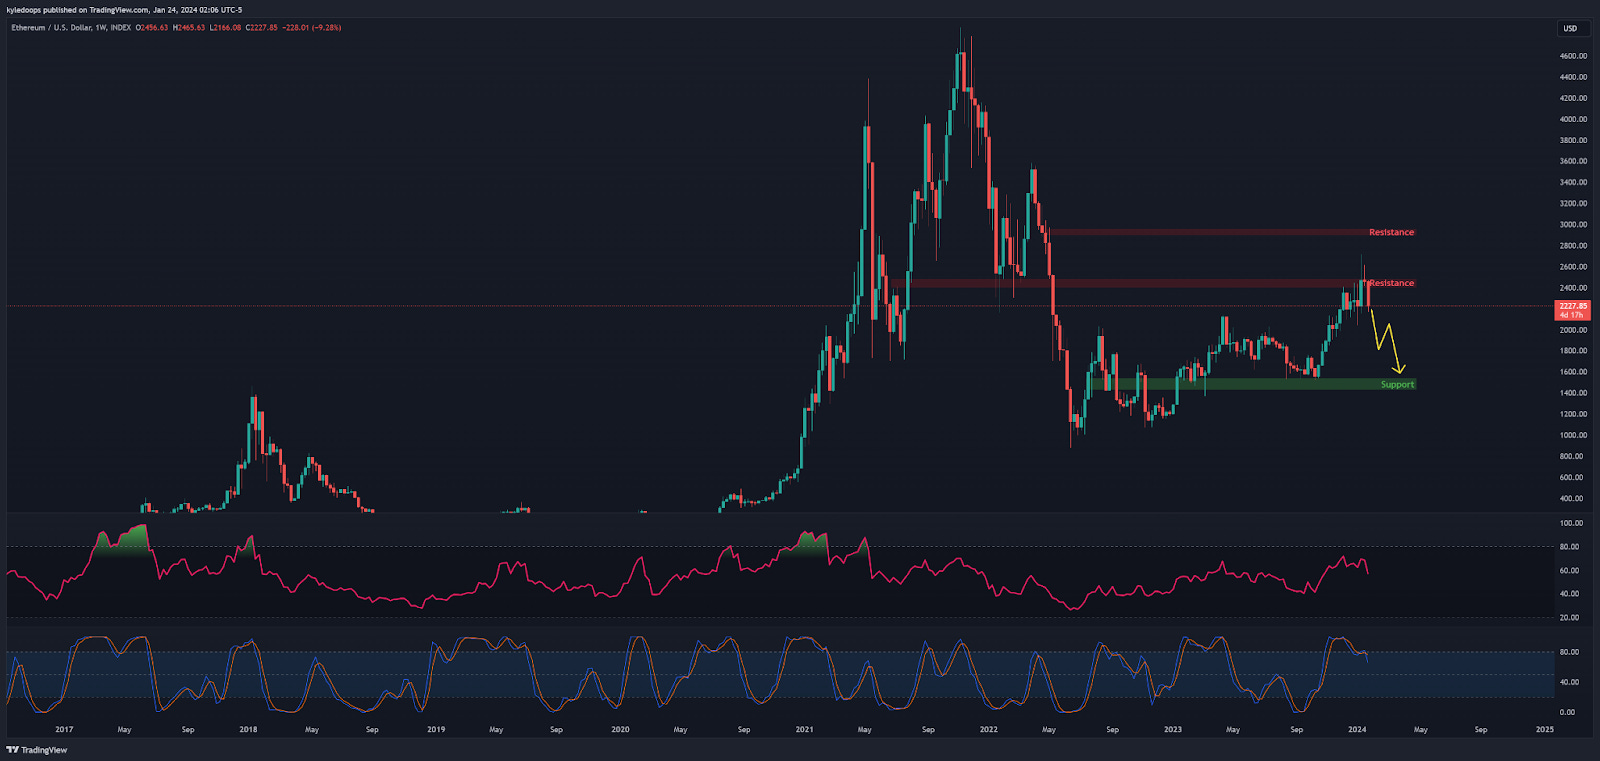
In the end, bulls did not manage to secure the $2,500 area; therefore, the resistance did not get the chance to be tested as support.
Now the price is looking for new support, possibly all the way down to $1,500. Maybe we will see a small pause at $1,950.
The Stochastic RSI is dropping, as is the RSI, indicating weakness. Also, we cannot ignore the Gravestone Doji that was printed at $2,500.
Claim your Bitget sign-up bonuses here (details below).
Chart #4 - Theta Network (THETAUSDT) 12-Hour
Chartist: Sheldon

(For the chart screenshot, click here.)
Yesterday, THETA found support at $0.88 before sharply reversing to its current trading level of $0.95.
I believe this is just a relief rally, with further downside expected in the next couple of days. But price will likely test the next areas of resistance before resuming its downward trend.
The next areas of resistance are at $0.97 - $1.025, followed by $1.10 - $1.15. Keep an eye out for price rejection in those areas, particularly if the price structure starts creating lower highs on the 4HR time frame and above. This could signal a possible trend reversal back to the downside, testing lower levels of support.
Claim your Bitget sign-up bonuses here (details below).
Chart #5 - Fear and Greed Index
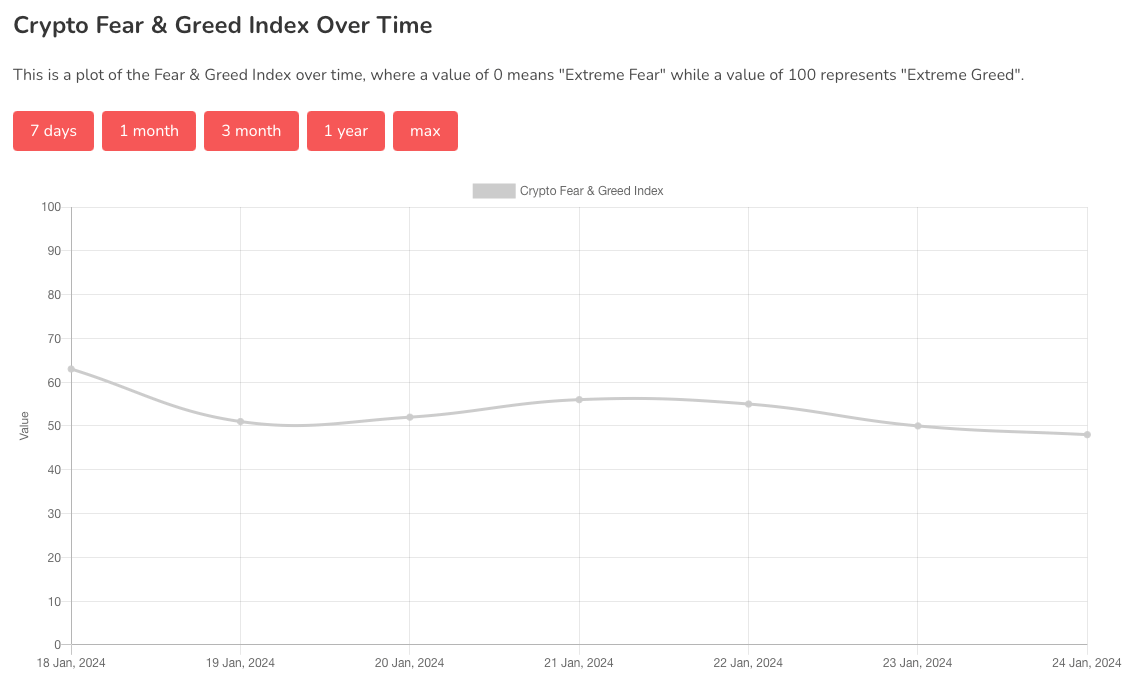
The Fear and Greed Index is sitting at 48 today, Neutral.
The highest the index has been over the past seven days is 63, and the lowest is 48.
Banter’s Take
Yesterday, during the US session, Bitcoin experienced a relief rally and encountered resistance at $40,200. Presently, the price is below $40,000 and consolidating. I anticipate a period of pause in this range before a potential continuation of the downward trend. On a smaller time frame, we may observe a formation of a lower high. Caution is advised, and it's important to avoid falling into any potential bull traps.
Stay safe my friends!
Go to our Crypto Banter Discord here where Sheldon and Kyle give updates on the charts and trades from The Daily Candle newsletter!