

📈📉 ETH is Losing to BTC! How Low Will It Go?
📈📉 ETH is Losing to BTC! How Low Will It Go?

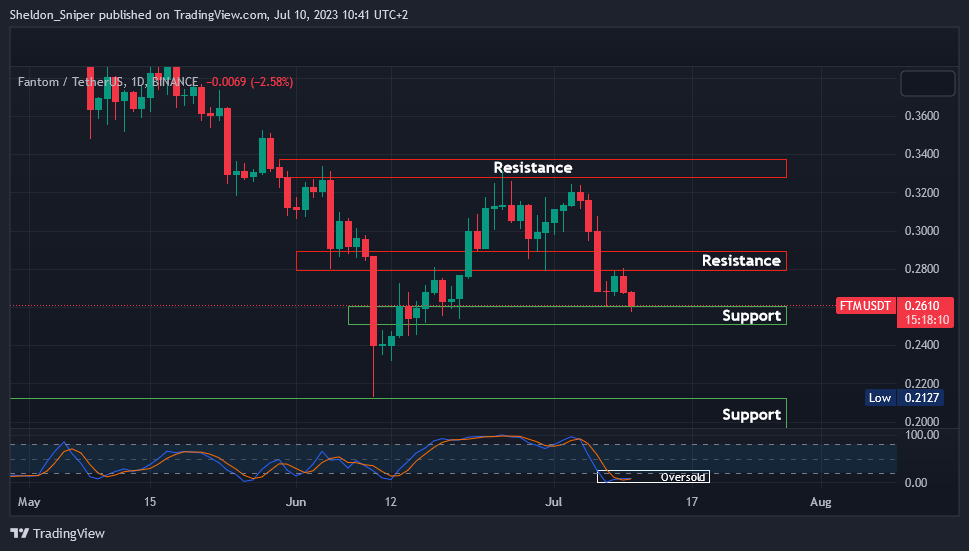
Chart #1 - Fantom (FTMUSDT) 1-Day Chart
Chartist: Sheldon
(For the chart screenshot, click here.)
Over the past week, FTM has experienced a notable price retracement due to FUD.
The price has dropped from $0.32 to $0.26 and is currently oversold. It’s now in the $0.255 - $0.26 support zone, where I expect a reaction that could result in a bounce up to test the next resistance zone at $0.28 - $0.29.
If the current support fails to hold, the next support is found in the range low area of $0.198 - $0.21.
Sign-up and trade on Bybit today.
Exclusive $30,000 deposit rewards and bonuses up for grabs!
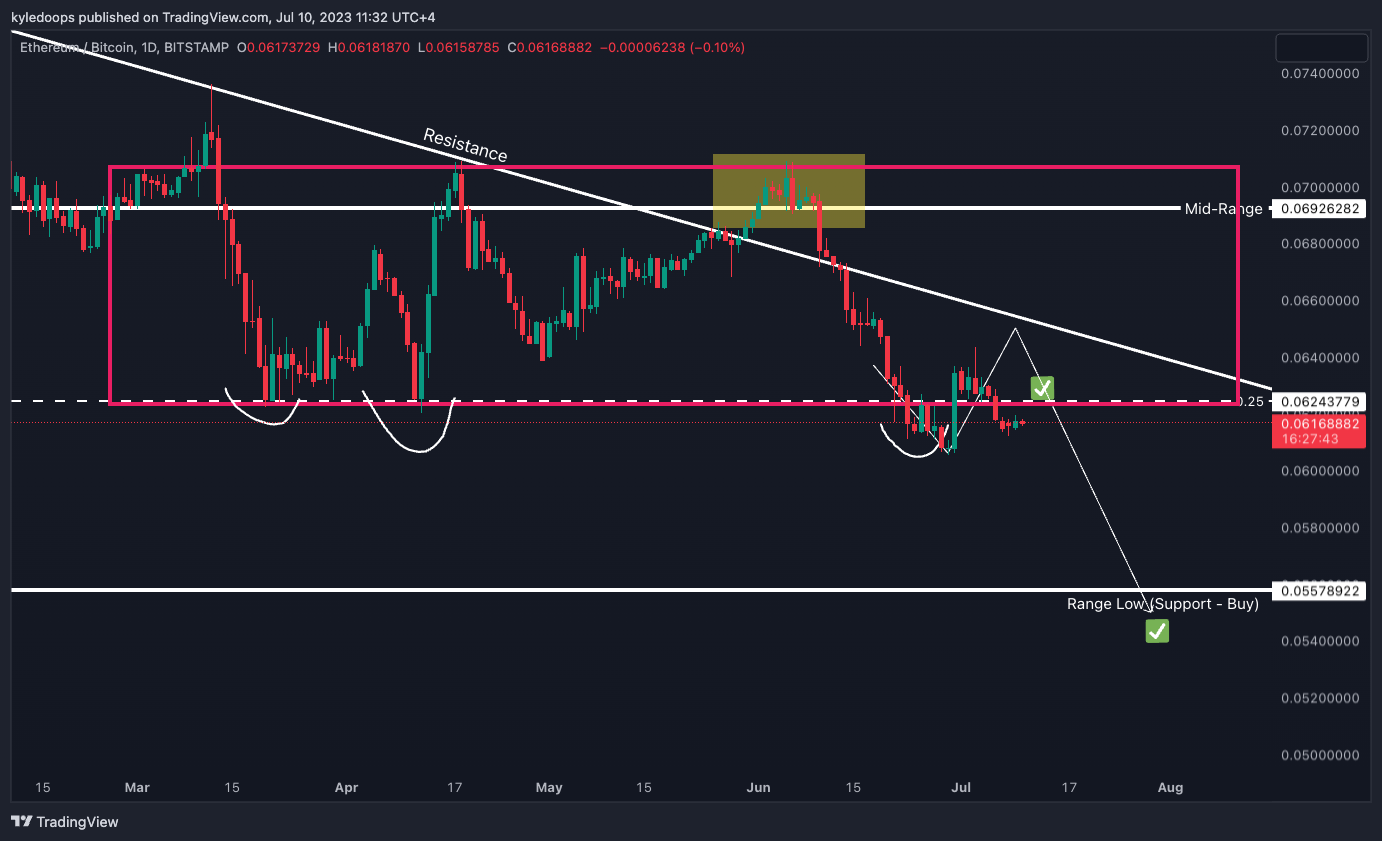
Chart #2 - Ethereum to Bitcoin Ratio (ETHBTC) 1-Day Chart
Chartist: Kyle
(For the chart screenshot, click here.)
ETH is currently below the 0.25 level of the range.
As long as it continues to consolidate under this level, I would anticipate a push down to 0.05578922, which would represent the ultimate range low.
So far, transitioning from ETH to BTC has been a beneficial move. This strategy was outlined in The Daily Candle a couple of weeks ago.
𝗣𝗿𝗶𝗺𝗲 𝗫𝗕𝗧
Sign up for a new Trading Account on Prime XBT!
Receive a deposit bonus of up to $7,000 with promo code: KyleDoops

Sign up for a new Trading Account on Prime XBT!
Receive a deposit bonus of up to $7,000 with promo code: SheldonSniper
Chart #3 - Bitcoin (BTCUSD) 1-Hour Chart
Chartist: Kyle

(For the chart screenshot, click here.)
Bitcoin continues to remain range-bound, maintaining the quarterly range level at $29,968.
With the market deleveraging into the major economic data expected this week, a sweep of the range low at $29,534 is not only possible but also likely.
If we see a sweep of the range low followed by a reclaim, it could present a promising long opportunity. This is also the area where liquidity is concentrated. Liquidity is stacked at $29,500 on the downside and $30,500 on the upside.
Claim your Bitget sign-up bonuses here (details below).
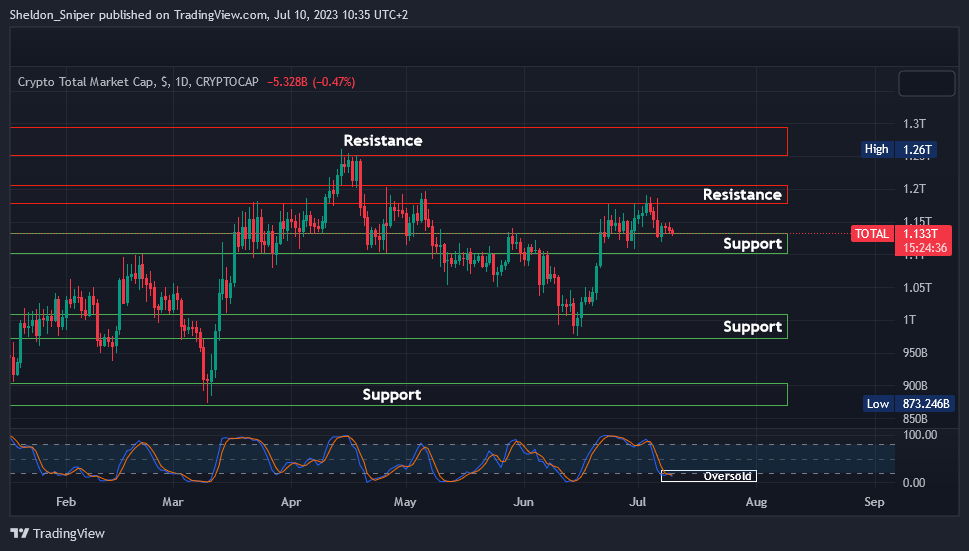
Chart #4 - TOTAL 1-Day Chart
Chartist: Sheldon
(For the chart screenshot, click here.)
Last week, the TOTAL faced rejection in the $1.18T - $1.2T resistance zone and has since fallen back to the next support area at $1.10T - $1.13T.
The higher time frame indicators show an oversold market, but it may remain like that for a while, maybe consolidating at the current support over the next few days.
If this support is lost, the next one is at $1.05T, with a major support zone below that at $975B - $1T. I still think there’s possible upside in the market over the next few weeks. Breaking the $1.18T - $1.2T resistance could pave the way to the next major resistance at $1.26T - $1.3T.
Claim your Bitget sign-up bonuses here (details below).
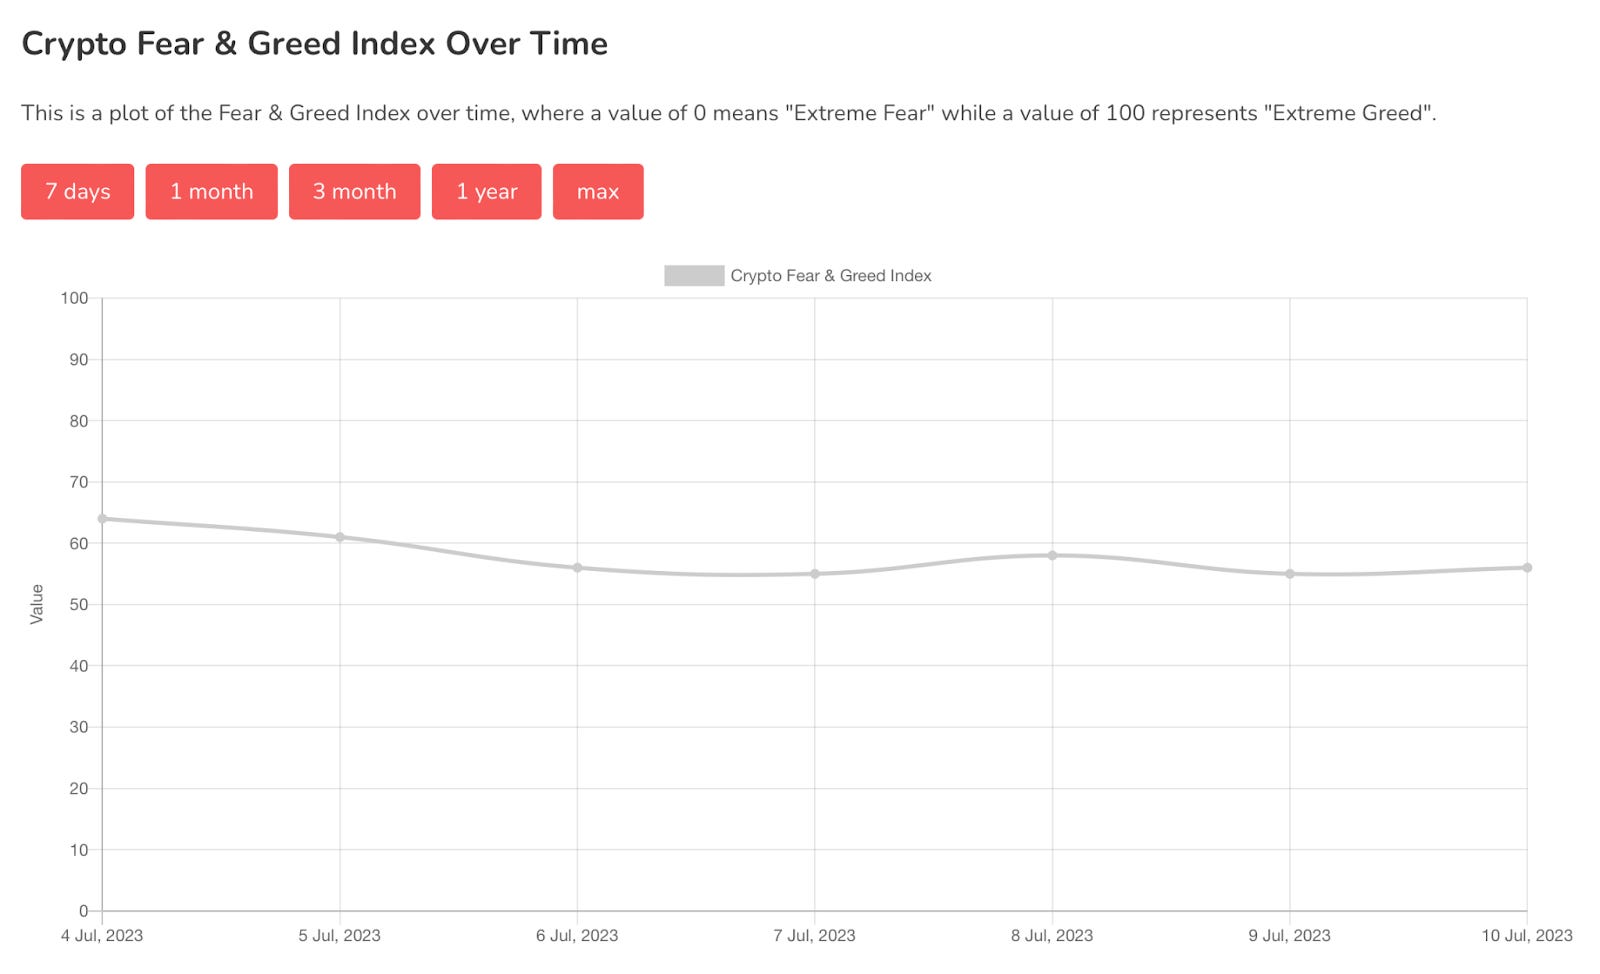
Chart #5 - Bitcoin Fear and Greed Index
The Bitcoin Fear and Greed Index is sitting at 56 today, indicating Greed.
The highest the index has been over the past seven days is 64, and the lowest is 55.
Banter’s Take
Based on the distribution of liquidity as per the order book, there is a high probability that the price will continue to range within a $1,000 bracket, specifically between $29,500 and $30,500. The significant move is likely to occur on Wednesday or Thursday, which would involve Bitcoin exiting the range.
Stay safe my friends!
Go to our Crypto Banter Discord here where Sheldon and Kyle give updates on the charts and trades from The Daily Candle newsletter!