

📈📉 ETH to $1,450? + SOL’s NEXT Move!
📈📉 ETH to $1,450? + SOL’s NEXT Move!
Overview
Chart #1 - Bitcoin (BTCUSDT) Daily
Chart #2 - Ethereum (ETHUSD) Daily
Chart #3 - Ethereum to Bitcoin Ratio (ETHBTC) Daily
Chart #4 - Solana (SOLUSDT) Daily
Chart #5 - Fear and Greed Index

Chart #1 - Bitcoin (BTCUSDT) Daily Chart
Chartist: Sheldon
(For the chart screenshot, click here.)
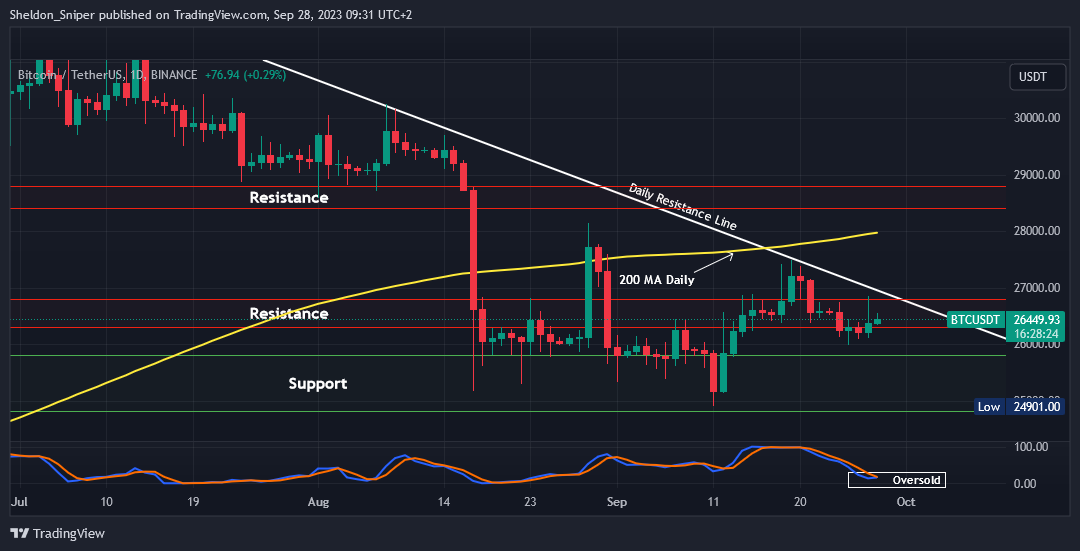
The price of Bitcoin is currently at $26,450, and this morning, it managed to reclaim the $26,300 support after yesterday's sell-off.
The price is also currently oversold on the daily time frame, and the indicator lines are crossing at the bottom, indicating a possibility of some upside in price in the near future.
If the price can break through the $26,800 - $27,000 resistance level, the next resistance is at the daily 200 Moving Average of $28,000.
Sign-up and trade on Bybit today.
Exclusive $30,000 deposit rewards and bonuses up for grabs!
Chart #2 - Ethereum (ETHUSD) Daily Chart
Chartist: Kyle
(For the chart screenshot, click here.)
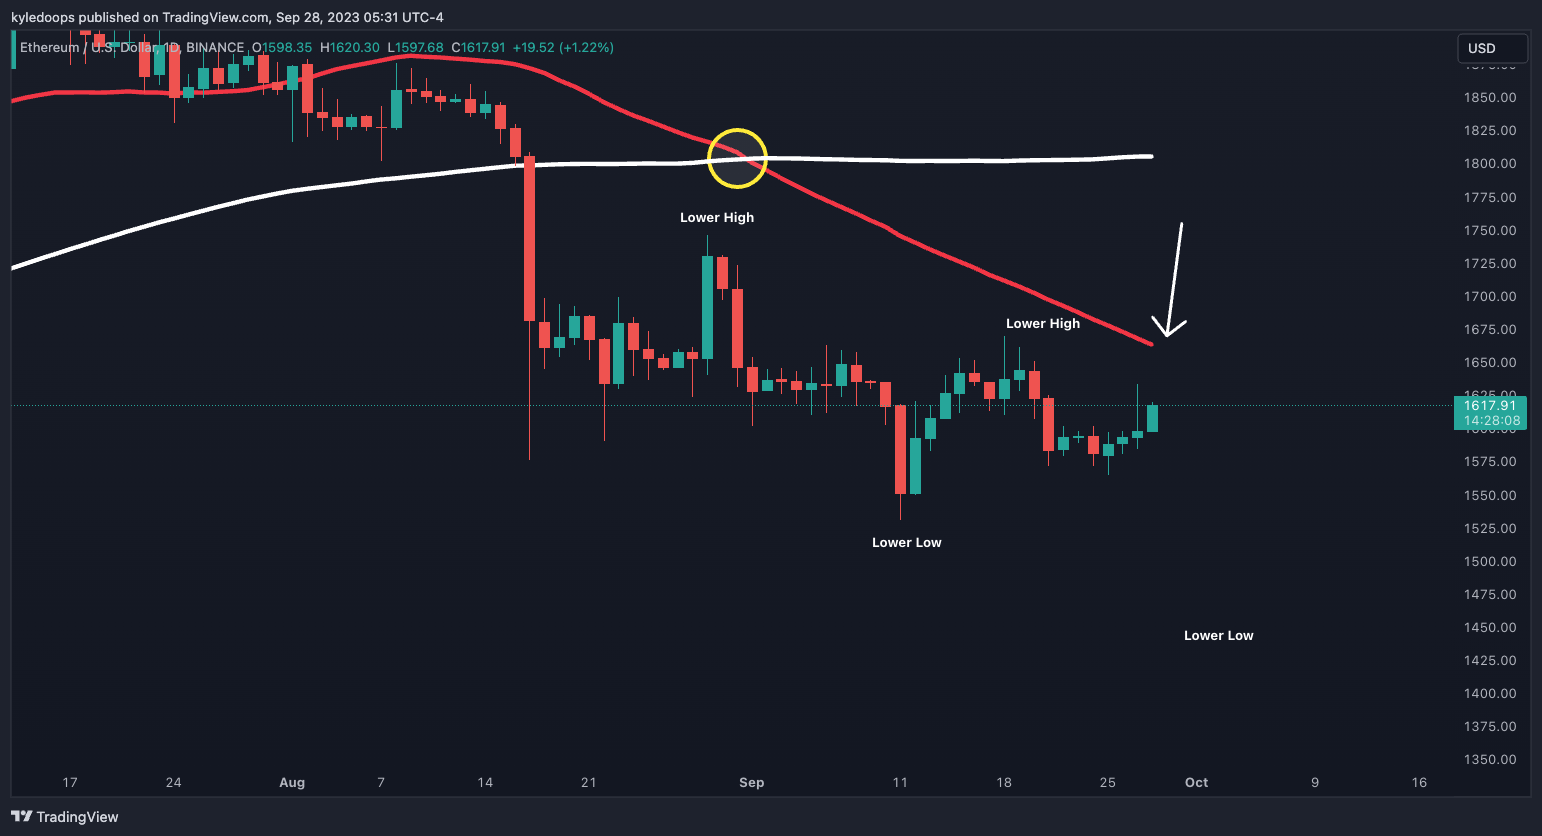
ETH is currently pushing up but will meet resistance at the 50MA on the daily.
This comes after a series of lower lows and lower highs following a death cross. If rejection occurs, the expectation should be that the price will move down to the $1,450 area, marking a new swing low.
This is where major support lies.
Claim your Bitget sign-up bonuses here.
Chart #3 - Ethereum to Bitcoin Ratio (ETHBTC) Daily Chart
Chartist: Kyle
(For the chart screenshot, click here.)
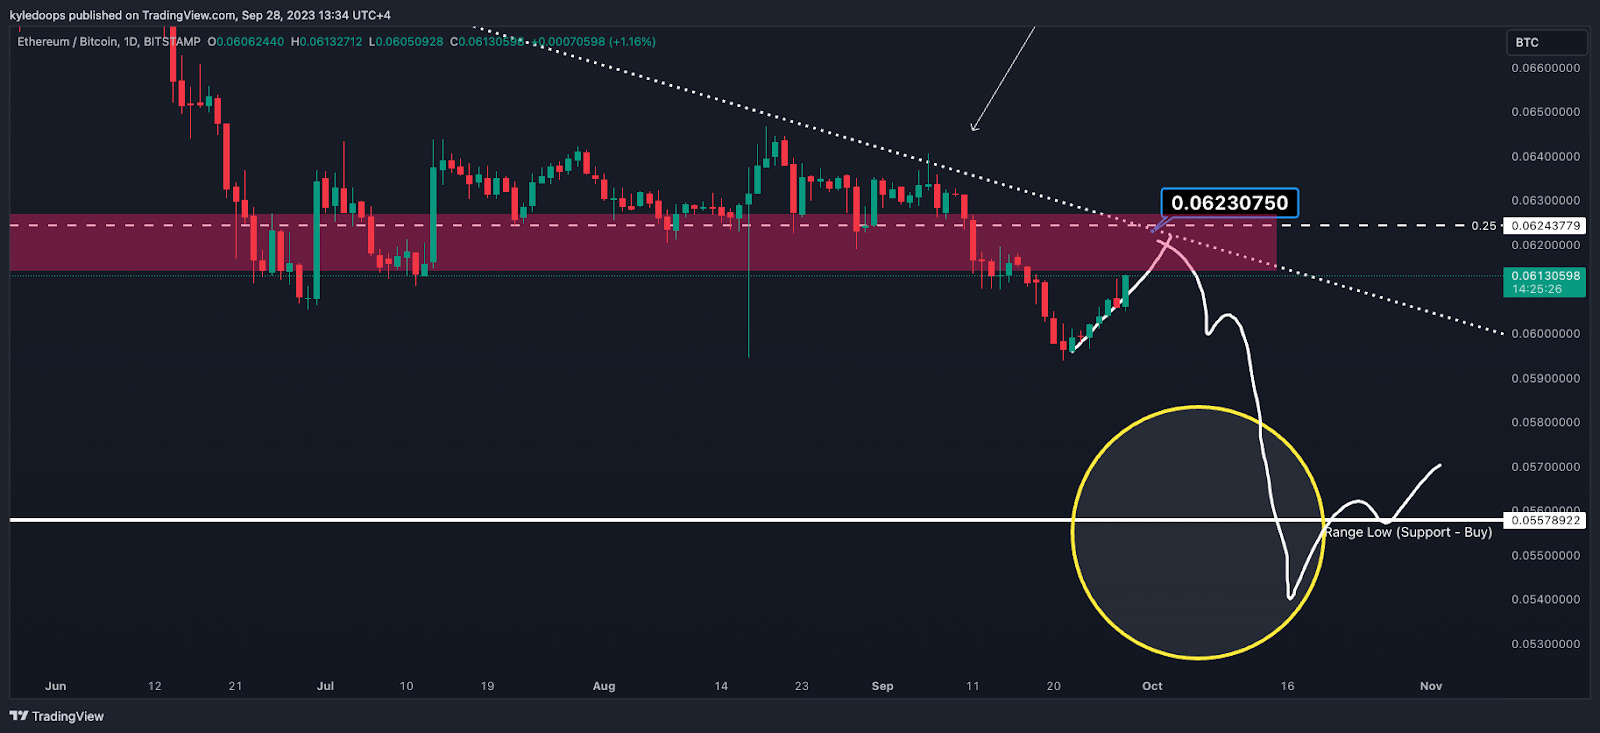
When you line up the ETH-BTC chart on the daily, you can see that this move is currently outperforming Bitcoin and is approaching underside resistance.
The sweet spot where you might expect a rejection is at 0.06230750. This point represents a confluence of strong underside resistance and diagonal resistance, as seen by the downtrending line.
Keep an eye out for major support at the range low, which stands at 0.055789.
Claim your Bitget sign-up bonuses here.
Chart #4 - Solana (SOLUSDT) Daily Chart
Chartist: Sheldon
(For the chart screenshot, click here.)
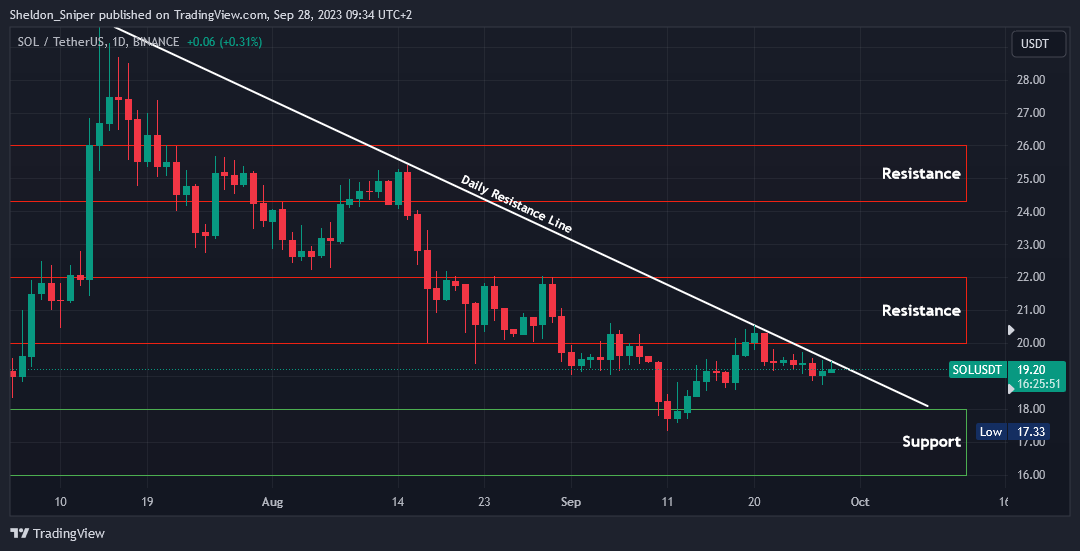
SOL is currently testing the descending resistance line that originates from mid-July. This line has been tested multiple times over the last 10 weeks, but has yet to be breached.
The price is currently at $19.20. If it can break through the daily resistance line, the next resistance level is at $20.00, with a possibility of even reaching the range high resistance level of $22.00.
However, if the price is rejected again at the daily resistance line, the next support level is at $18.00.
Claim your Bitget sign-up bonuses here (details below).
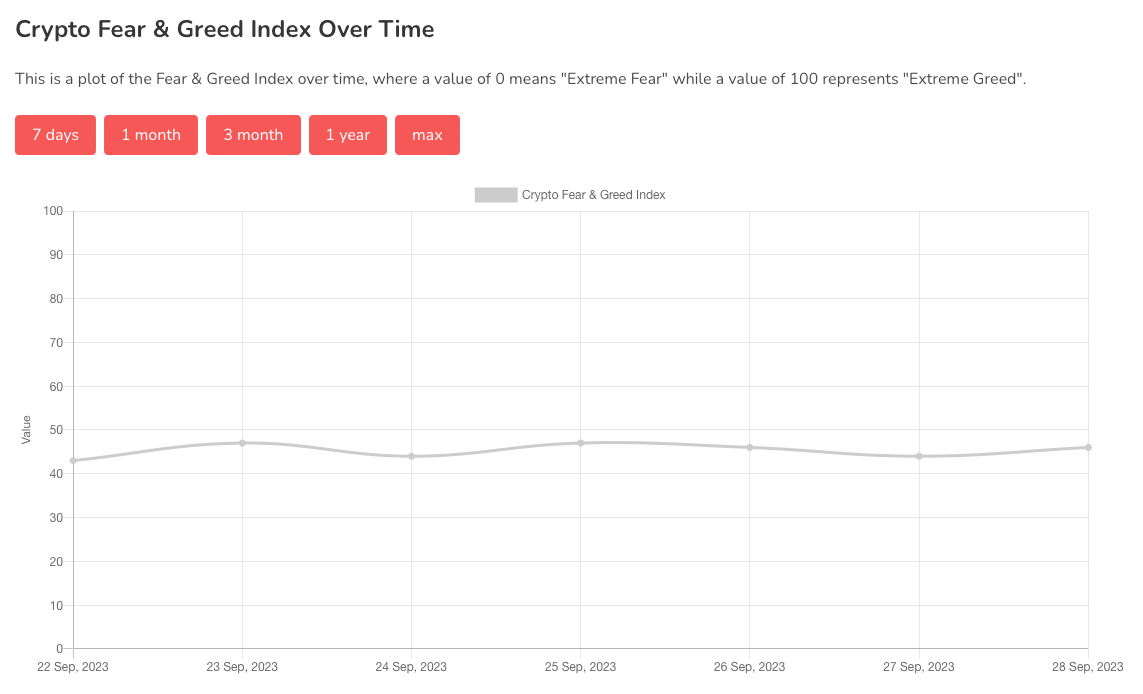
Chart #5 - Fear and Greed Index
The Fear and Greed Index is sitting at 46 today, indicating Fear.
The highest the index has been over the past seven days is 47, and the lowest is 43.
Banter’s Take
Bears are running out of time to drive the price down, and as a result, bulls will be looking to make a move. Given that September has historically been an incredibly bearish month, it creates an interesting scenario.
With only a couple of days left in the month, BTC might actually close in the green. This would be a bullish signal and could lead to a continuation higher in October.
Stay safe my friends!
Go to our Crypto Banter Discord here where Sheldon and Kyle give updates on the charts and trades from The Daily Candle newsletter!