

📈 ETH/BTC Hits Our TARGET! Is ETH the BETTER Play?
📈 ETH/BTC Hits Our TARGET! Is ETH the BETTER Play?
IMPORTANT: A New Trading Range Will Emerge!
Overview
Chart #1 - Crypto Total Market Cap (TOTAL) Daily
Chart #2 - Bitcoin (BTCUSD) Hourly
Chart #3 - Ethereum to Bitcoin Ratio (ETHBTC) Daily
Chart #4 - Solana (SOLUSDT) Daily
Chart #5 - Fear and Greed Index

Chart #1 - Crypto Total Market Cap (TOTAL) Daily
Chartist: Sheldon
(For the chart screenshot, click here.)
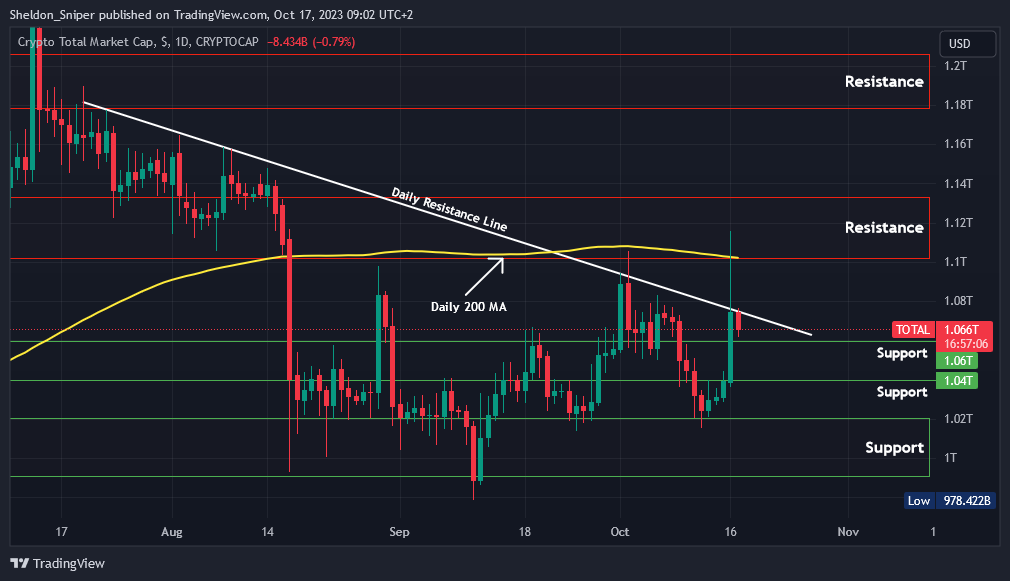
Yesterday, the TOTAL rallied from $1.04T up to almost $1.12T, before the ETF news was reported as fake. The market immediately reversed, with the TOTAL currently at $1.06T, on support.
It’s now also in a tight range, between the $1.06T support and the daily descending resistance line from the middle of July, at around $1.075T. The line has been tested three times over the last three weeks, but if it can be broken, the next resistance is at $1.1T, at the daily 200 Moving Average.
Sign-up and trade on Bybit today.
Exclusive $30,000 deposit rewards and bonuses up for grabs!
Chart #2 - Bitcoin (BTCUSD) Hourly
Chartist: Kyle
(For the chart screenshot, click here.)
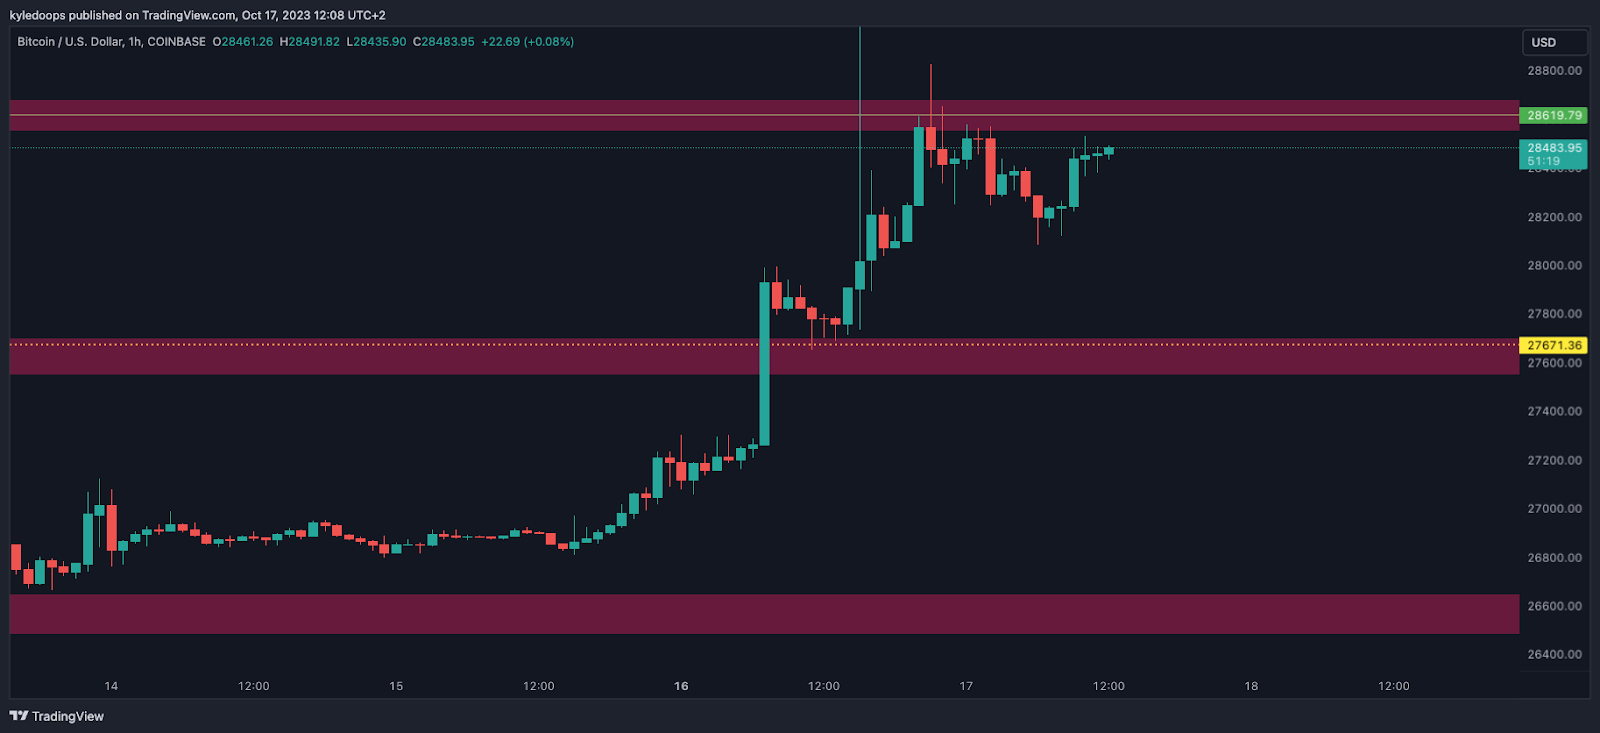
Despite the massive pump due to the false ETF approval, Bitcoin is still respecting the levels drawn.
The primary range remains between $26,600 - $28,600, with the price currently oscillating between the range high and the mid-range.
If bulls succeed in reclaiming $28,600 and maintain it, then $30,000 becomes the next range high, which precisely matches where yesterday's candle was rejected.
Claim your Bitget sign-up bonuses here (details below).
Chart #3 - Ethereum to Bitcoin Ratio (ETHBTC) Daily
Chartist: Kyle
(For the chart screenshot, click here.)
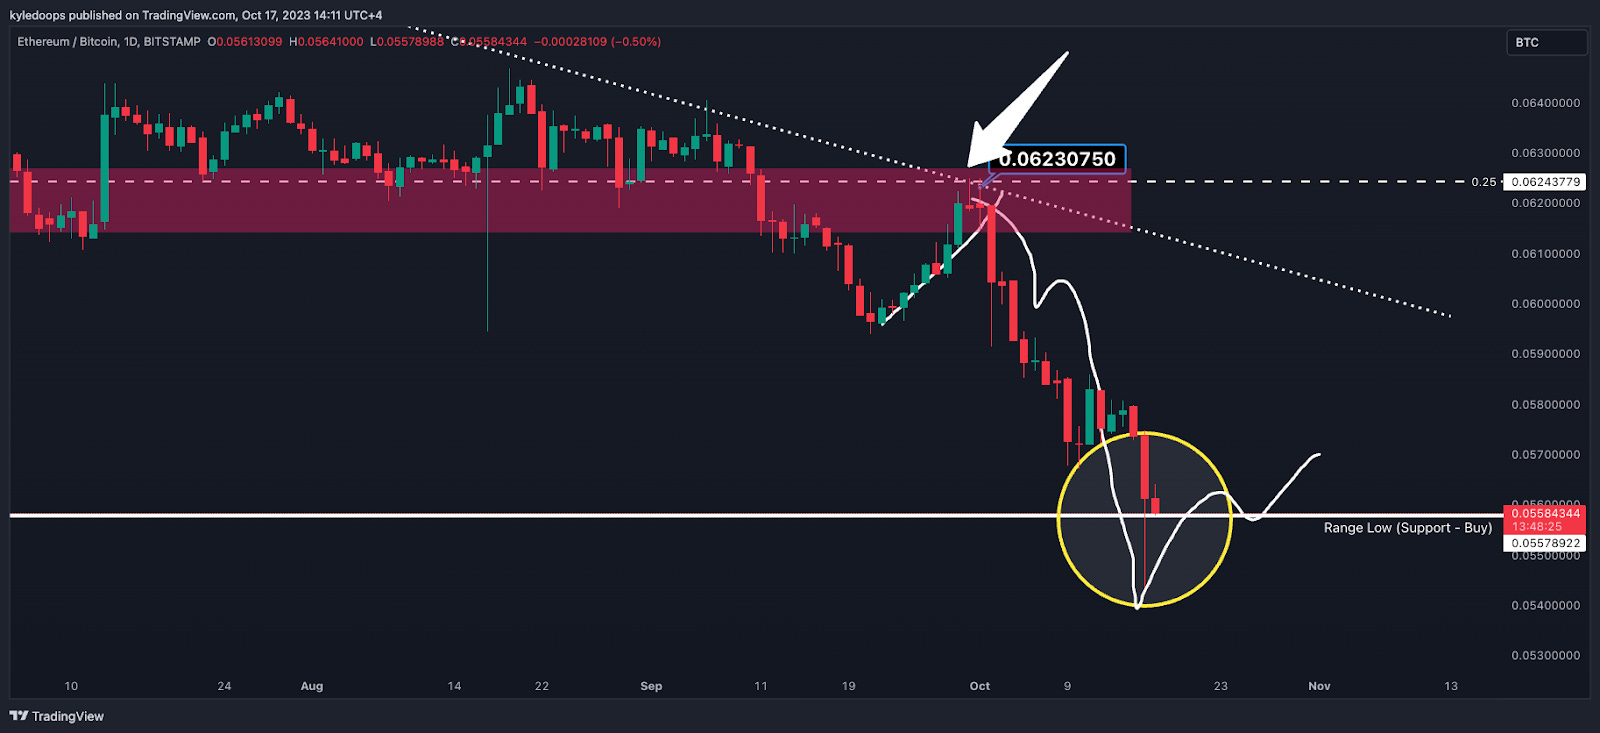
The long-awaited ETHBTC target has now been reached.
With Bitcoin outperforming ETH, it has now touched the 0.055789 level, which was the intended buy target.
This is contingent on this level holding firm. If it does, and BTC dominance is rejected, then expect that ETH will be the more favorable play.
Claim your Bitget sign-up bonuses here (details below).
Chart #4 - Solana (SOLUSDT) Daily
Chartist: Sheldon
(For the chart screenshot, click here.)
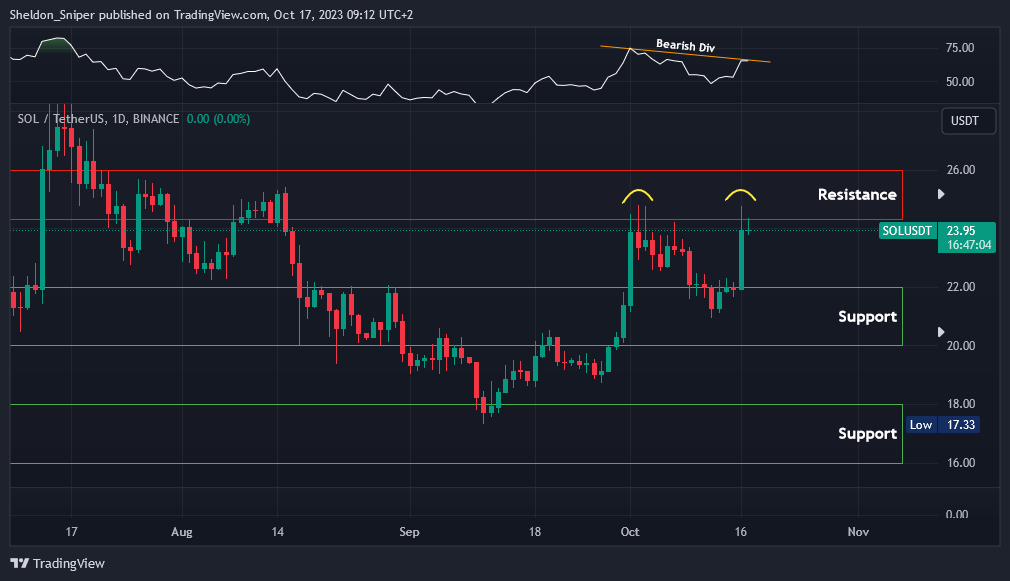
SOL is testing $24.00.
The price was already rejected in this region earlier in October. Yesterday's rally up to the $24 also created a Bearish Divergence, where the price mirrors its position on October 2nd, but the daily RSI doesn't confirm yesterday's move.
The price might also be forming a bearish double top.
If it does reverse from here, the immediate support stands at $23, while the next major support range lies between $20 - $22.
If the price continues its upward trend, the subsequent resistance is at the range high of $26.
Claim your Bitget sign-up bonuses here (details below).
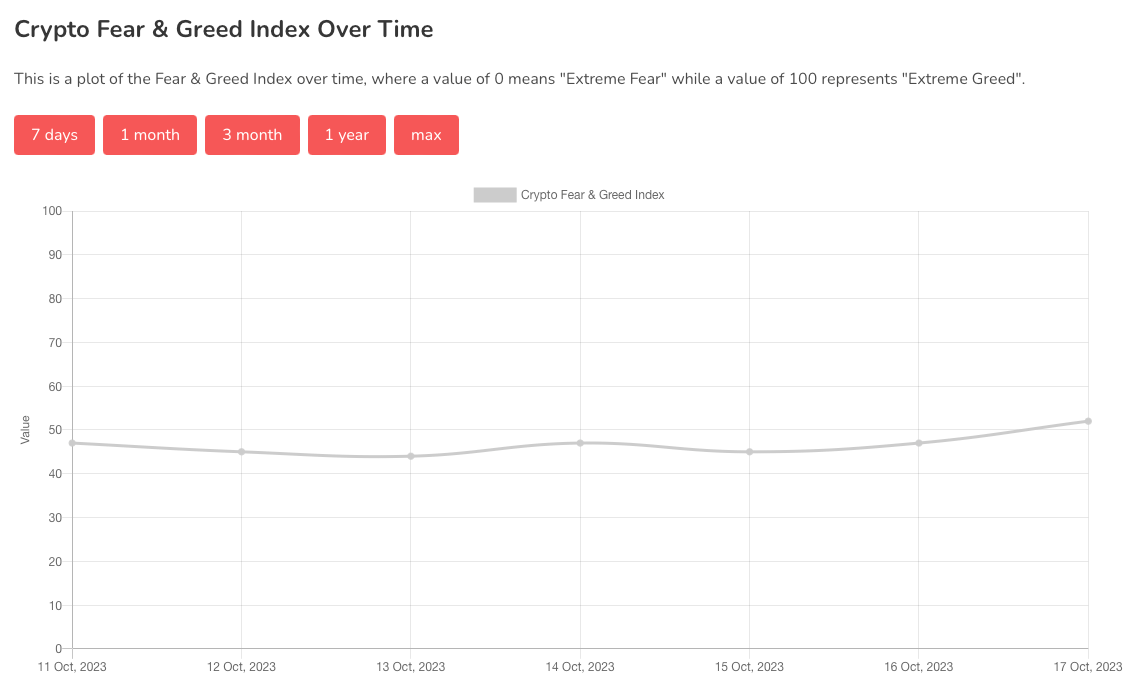
Chart #5 - Fear and Greed Index
The Fear and Greed Index is sitting at 52 today, Neutral.
The highest the index has been over the past seven days is 52, and the lowest is 44.
Banter’s Take
In the wake of the false ETF news, the price will now recalibrate based on the recent events and address the inconsistencies. This means that a new trading range will emerge.
Stay safe my friends!
Go to our Crypto Banter Discord here where Sheldon and Kyle give updates on the charts and trades from The Daily Candle newsletter!