

📈📉ETH/BTC is Rejecting! + Alts to SUFFER?
📈📉ETH/BTC is Rejecting! + Alts to SUFFER?
ETH/BTC is rejecting from the EXACT level we expected!
Overview
Chart #1 - Bitcoin (BTCUSDT) Daily
Chart #2 - Ethereum to Bitcoin Ratio (ETHBTC) Daily
Chart #3 - Bitcoin Dominance (BTC.D) Weekly
Chart #4 - Avalanche (AVAXUSDT) 12-Hour
Chart #5 - Fear and Greed Index

Chart #1 - Bitcoin (BTCUSDT) Daily Chart
Chartist: Sheldon
(For the chart screenshot, click here.)
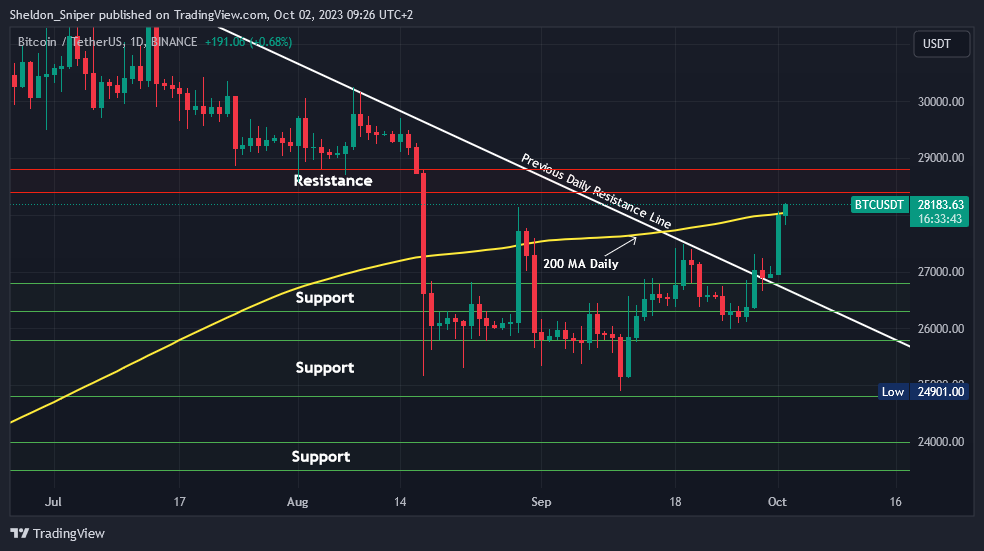
Over the past week, Bitcoin has rallied by over 8.5%, rising from around $26,000 to its current price of $28,200.
It has successfully reclaimed the daily 200 Moving Average at $28,000 and has also breached the descending resistance line at $27,000. The price is approaching the next resistance zone between $28,400 and $28,800, which previously served as a significant support at the end of July and beginning of August.
This zone will be tough resistance. If the price faces rejection, it might descend to test $27,800.
Sign-up and trade on Bybit today.
Exclusive $30,000 deposit rewards and bonuses up for grabs!
Chart #2 - Ethereum to Bitcoin Ratio (ETHBTC) Daily Chart
Chartist: Kyle
(For the chart screenshot, click here.)
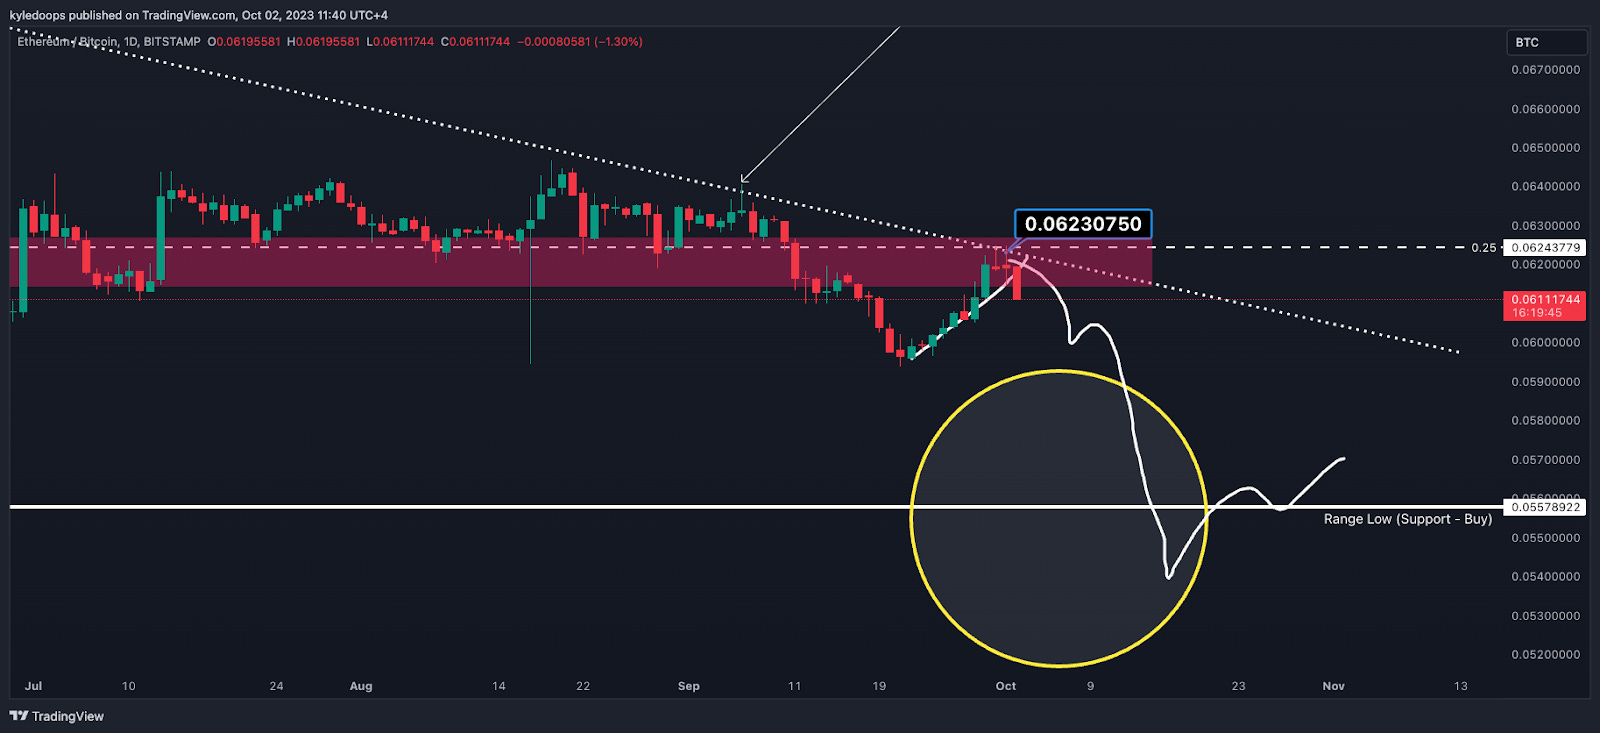
ETHBTC is rejecting from the exact level we expected at 0.06243779.
If the rejection continues, the price will likely continue down to the range low support at 0.05578922.
This, of course, means that for the most, altcoins will suffer against Bitcoin, which is supported by the rising Bitcoin dominance.
Claim your Bitget sign-up bonuses here (details below).
Chart #3 - Bitcoin Dominance (BTC.D) Weekly Chart
Chartist: Kyle
(For the chart screenshot, click here.)
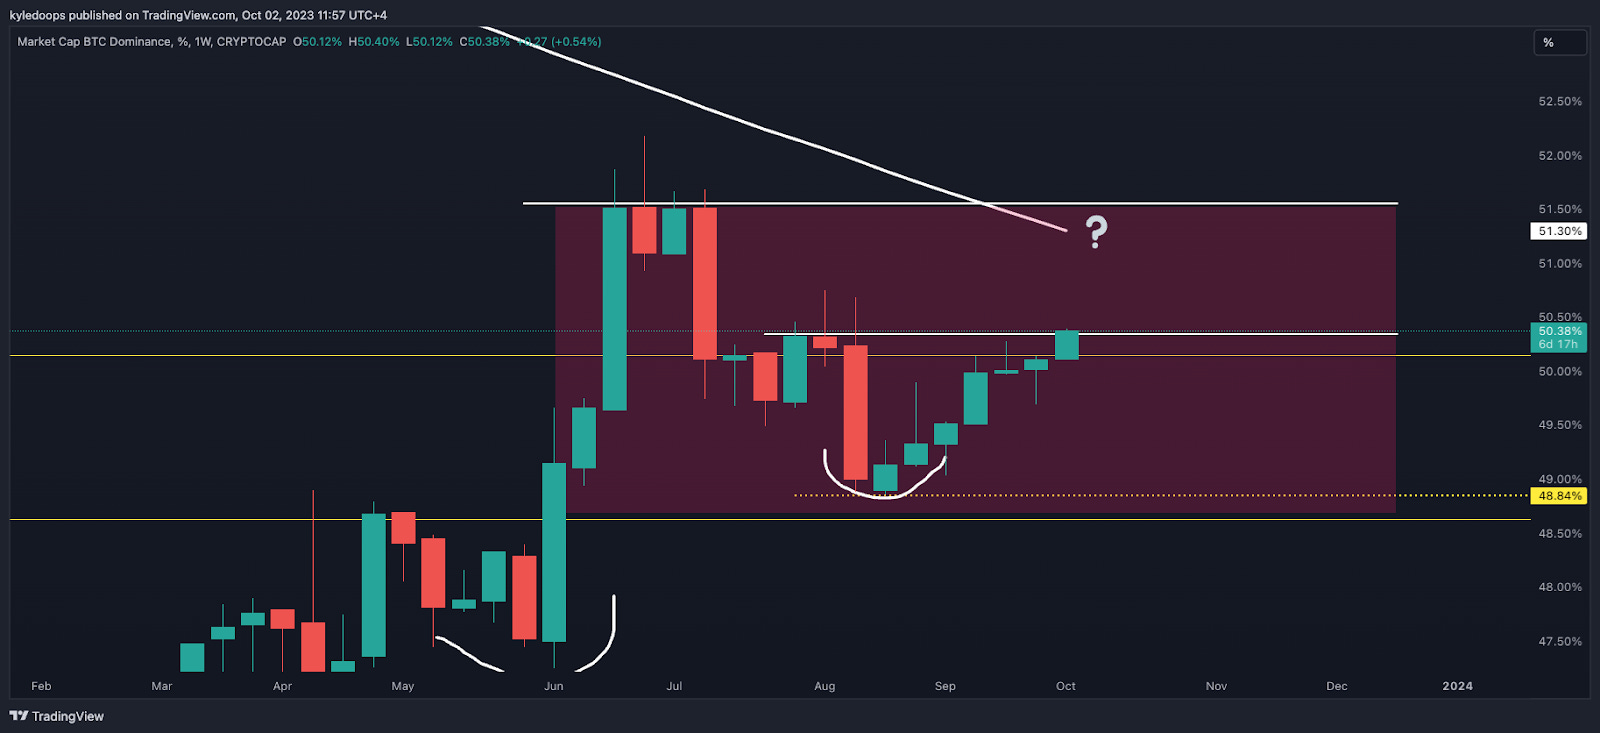
Bitcoin dominance appeared to be rejecting 2 weeks ago, and it wasn’t looking promising.
Now, BTC.D is reclaiming a key level and faces its next resistance at the declining 200-week MA. If BTC.D can surpass 51.50% and maintain above that level, then a significant breakout is probable.
So, a dominance of 55 - 60% is once again a possibility.
Claim your Bitget sign-up bonuses here (details below).
Chart #4 - Avalanche (AVAXUSDT) 12-Hour Chart
Chartist: Sheldon

(For the chart screenshot, click here.)
After rallying by almost 8% this week, AVAX's price has hit its first big resistance zone between $9.75 - $10.15.
With the price now at $9.77, I expect a rejection in this zone, leading to a possible retracement to the next support level of $9.50.
Claim your Bitget sign-up bonuses here (details below).
Chart #5 - Fear and Greed Index
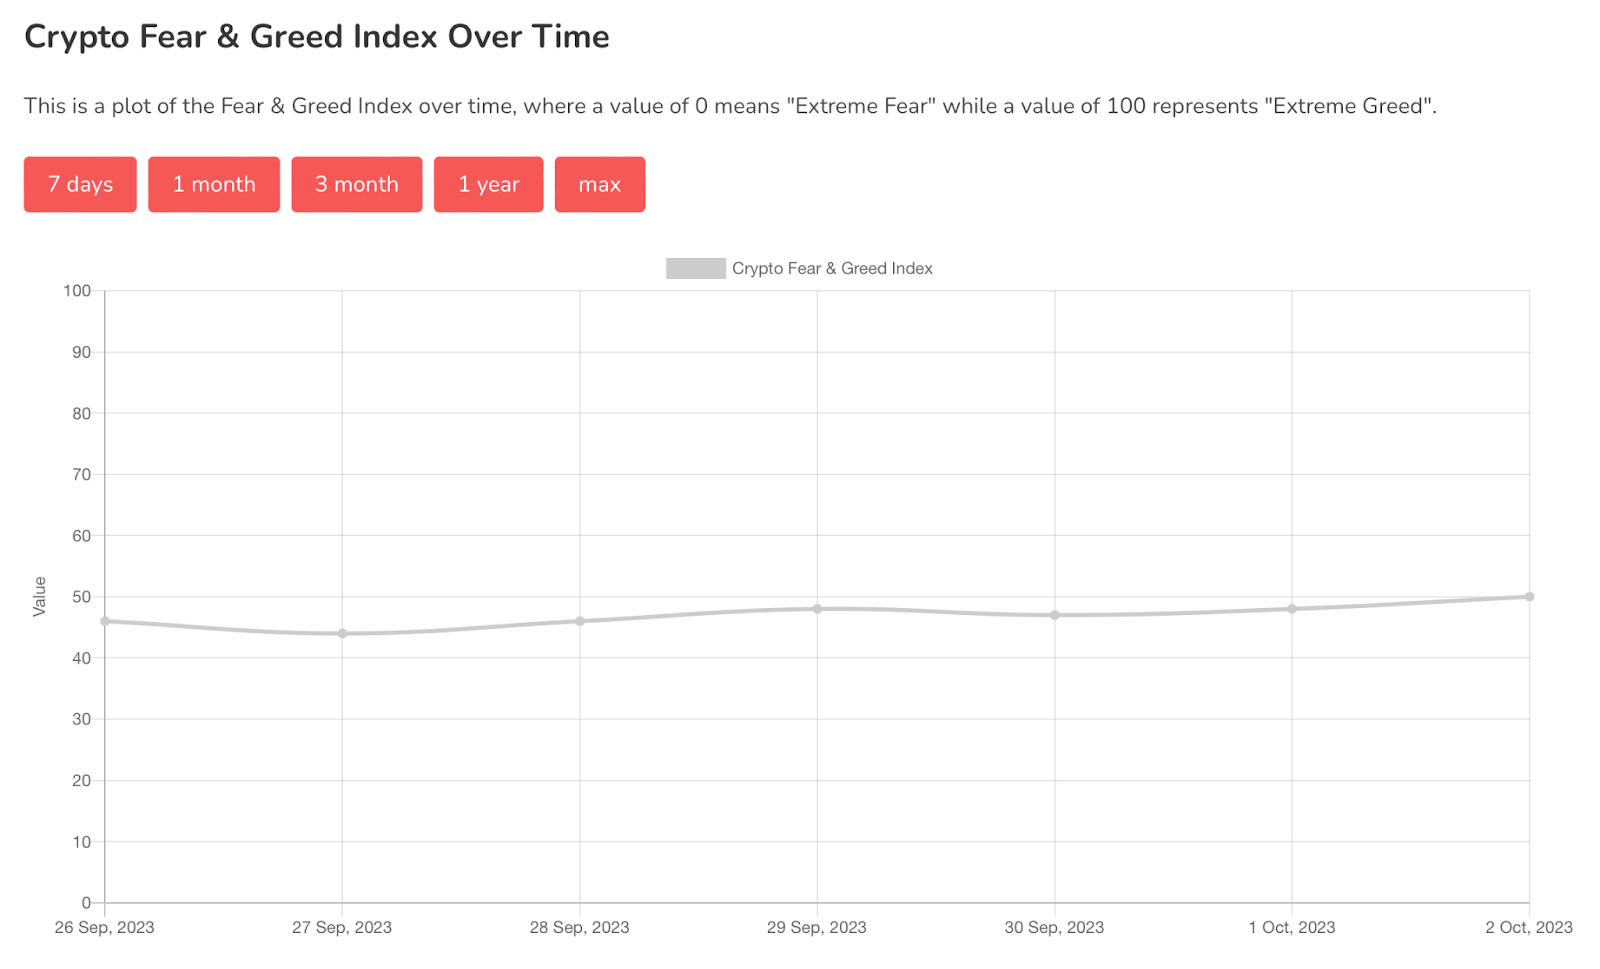
The Fear and Greed Index is sitting at 50 today, Neutral.
The highest the index has been over the past seven days is 50, and the lowest is 44.
Banter’s Take
The Bitcoin move appears strong, and if the price can reclaim and hold above both the 200-day and 200-week MA, then bulls could likely take full control, making October a promising month.
Stay safe my friends!
Go to our Crypto Banter Discord here where Sheldon and Kyle give updates on the charts and trades from The Daily Candle newsletter!