

📈📉 Expect LOWER Prices if the S&P 500 Loses THIS Level!
📈📉 Expect LOWER Prices if the S&P 500 Loses THIS Level!

Overview
Chart #1 - U.S. Dollar (DXY) Daily Chart
Chart #2 - Bitcoin (BTCUSD) Hourly Chart
Chart #3 - S&P 500 Futures (ES1!) Daily Chart
Chart #4 - Crypto Total Market Cap (TOTAL) Daily Chart
Chart #5 - Fear and Greed Index

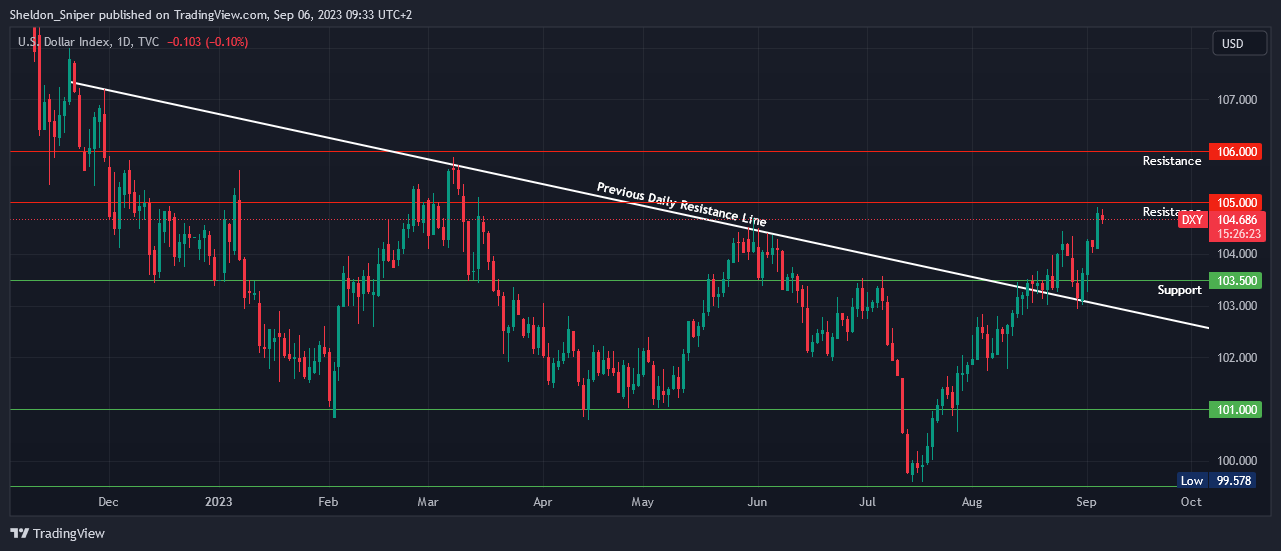
Chart #1 - U.S. Dollar (DXY) Daily Chart
Chartist: Sheldon
(For the chart screenshot, click here.)
Currently, the DXY is forming a bearish candle on the daily chart!
If it faces rejection at this current area of resistance, it could potentially drop to test the next support zone at 103.50 - 104.00, offering some relief to risk-on markets.
A breach of 105.00, and the next resistance stands at 106.00, spelling trouble for the risk-on markets.
𝗣𝗿𝗶𝗺𝗲 𝗫𝗕𝗧
Sign up for a new Trading Account on Prime XBT!
Receive a deposit bonus of up to $7,000 with promo code: SheldonSniper
Sign-up and trade on Bybit today.
Exclusive $30,000 deposit rewards and bonuses up for grabs!
Chart #2 - Bitcoin (BTCUSD) Hourly Chart
Chartist: Kyle

(For the chart screenshot, click here.)
Bitcoin is maintaining an extremely tight range between $26,455 - $25,338.
The risk is skewed to the downside on the higher time frame, and the expectation is that trading activity will only pick up once one of the extremes is breached. In other words, either a sweep of the high or a sweep of the low needs to occur.
Until then, traders would be wise to exercise patience before seeking out the next low-time-frame trade setup.
𝗣𝗿𝗶𝗺𝗲 𝗫𝗕𝗧
Sign up for a new Trading Account on Prime XBT!
Receive a deposit bonus of up to $7,000 with promo code: KyleDoops
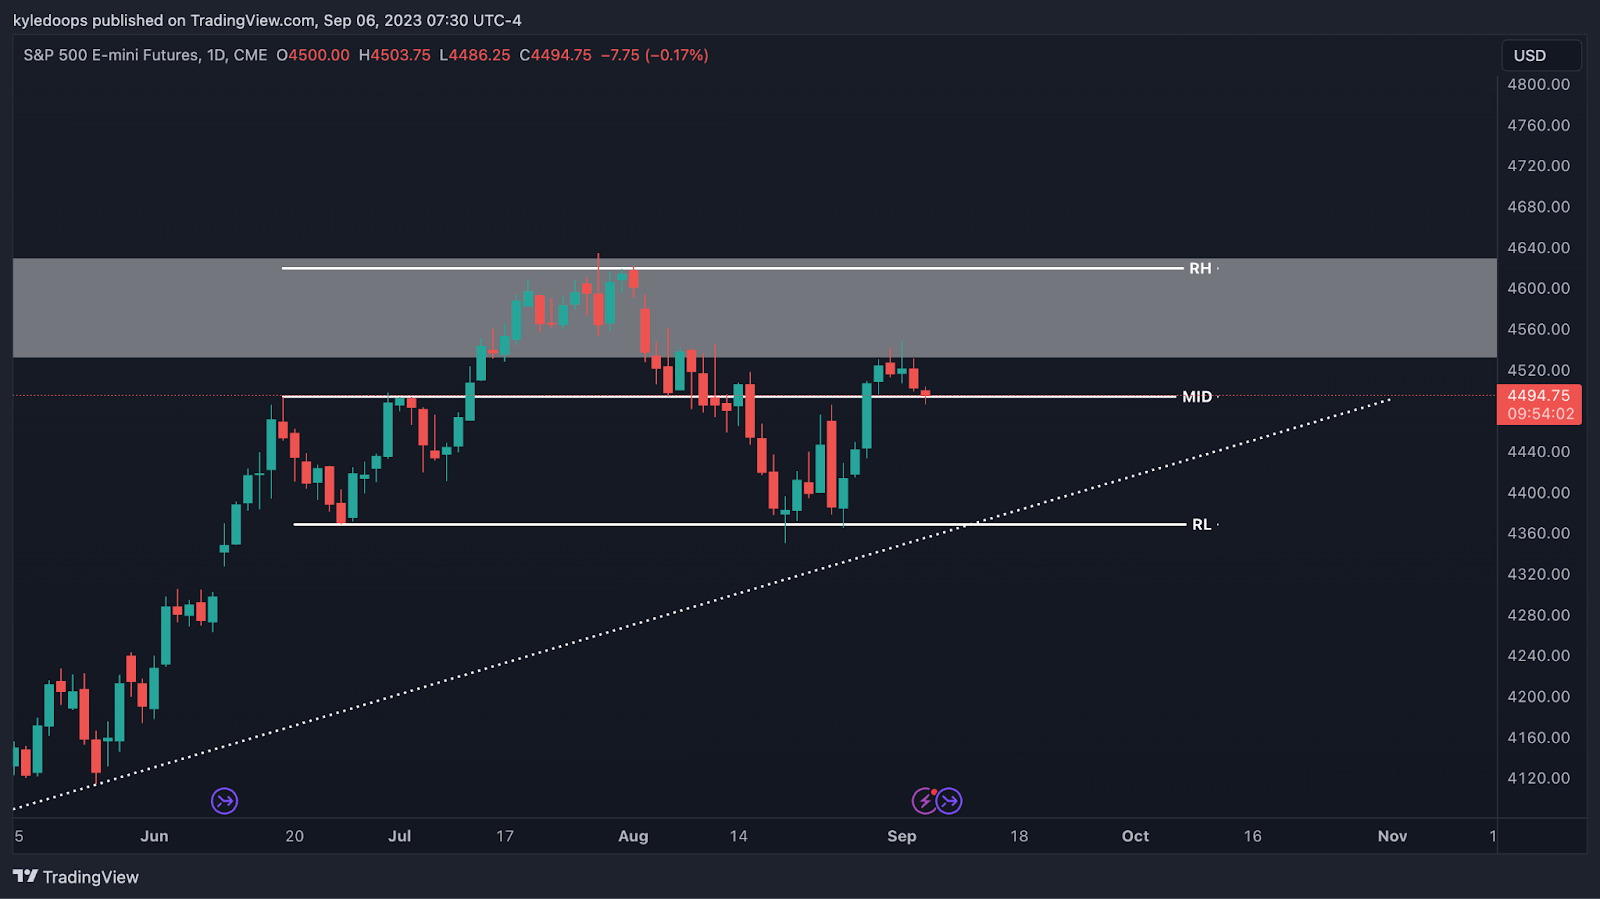
Chart #3 - S&P 500 Futures (ES1!) Daily Chart
Chartist: Kyle
(For the chart screenshot, click here.)
The S&P 500 is maintaining its position in the mid-range at 4,494.
If the stock market can continue to hold this level and gradually move higher, it could potentially buoy the crypto market as well. However, if this mid-level is lost, I anticipate that Bitcoin will also lose its major support and begin its downward expansion phase.
For the stock market, the critical level to hold is 4,368; failure to do so could lead to significantly lower prices.
Claim your Bitget sign-up bonuses here (details below).
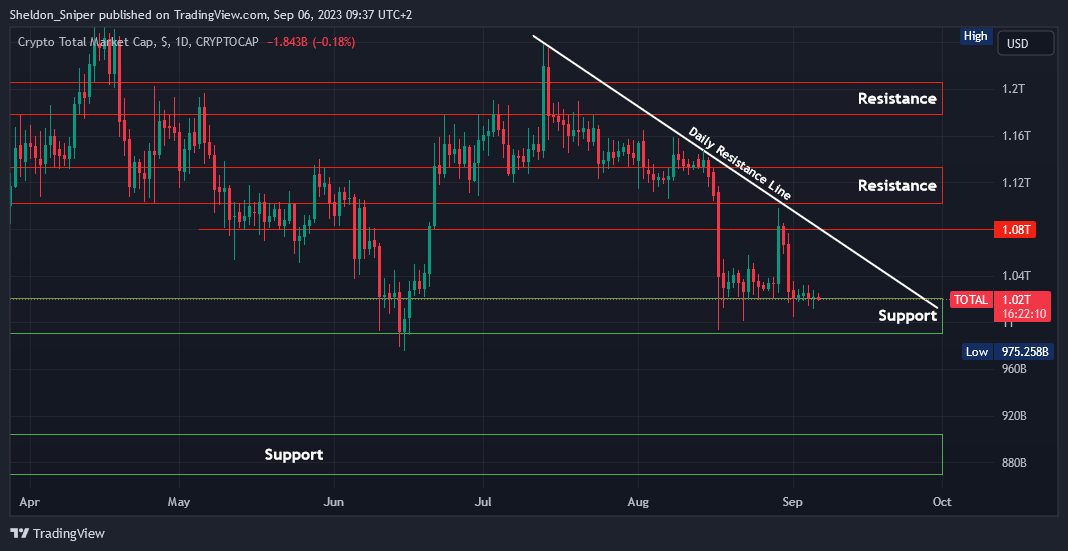
Chart #4 - Crypto Total Market Cap (TOTAL) Daily Chart
Chartist: Sheldon
(For the chart screenshot, click here.)
Over the past three weeks, the $1.02T level has served as support for the TOTAL.
Now, I'm eyeing a potential upward move with the TOTAL possibly testing the daily descending resistance line that originated in mid-July, around the $1.06T mark.
On the other hand, if the $1.02T support is breached and the TOTAL drops to the next support level around $990B before reversing, I'd anticipate a test of the descending resistance line to happen between $1.02T - $1.04T.
Should the Total Market lose the $990B support level, the next area of support to watch for is between $870B - $900B.
Claim your Bitget sign-up bonuses here (details below).
Chart #5 - Fear and Greed Index
The Fear and Greed Index is sitting at 42 today, indicating Fear.
The highest the index has been over the past seven days is 52, and the lowest is 39.

Banter’s Take
If the stock market can maintain its strength through the end of September, then Q4 is likely to be more bullish, in line with seasonal trends. So, as long as both Bitcoin and the stock market can defend their key levels, we're more likely closer to the bottom than not.
Stay safe my friends!
Go to our Crypto Banter Discord here where Sheldon and Kyle give updates on the charts and trades from The Daily Candle newsletter!