
📈📉 Explosive ATOM Move Incoming! + BTC to $28K?

Overview
Chart #1 - Bitcoin (BTCUSDT) Daily Chart
Chart #2 - Cosmos (ATOMUSDT) Daily Chart
Chart #3 - Oil (WTI) Daily Chart
Chart #4 - Solana (SOLUSDT) Daily Chart
Chart #5 - Fear and Greed Index

Chart #1 - Bitcoin (BTCUSDT) Daily Chart
Chartist: Sheldon
(For the chart screenshot, click here.)
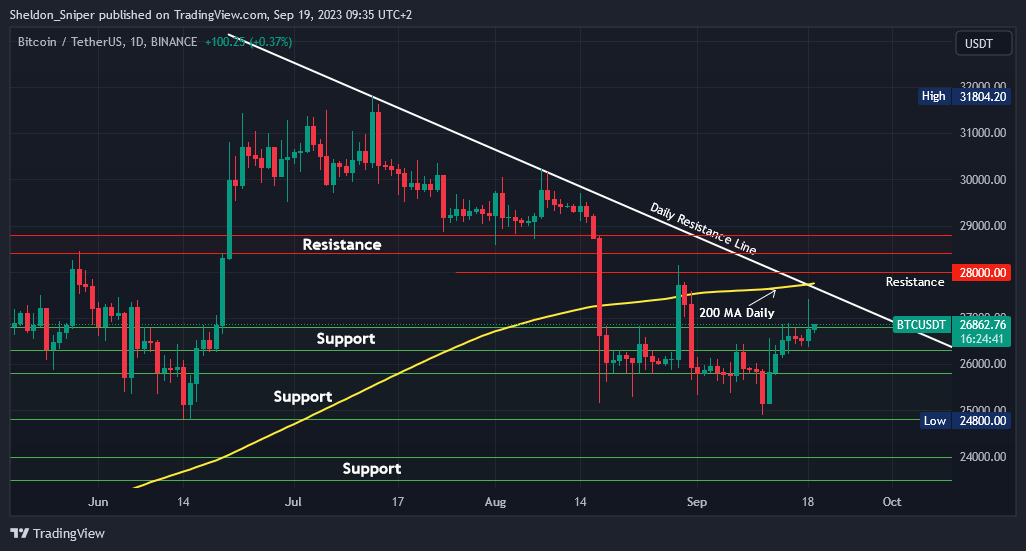
Bitcoin has reclaimed the $26,800 level as support and might consolidate here before attempting to test the next resistance level.
That resistance is signified by both the 200 Moving Average on the daily and the daily descending line originating from mid-July, pegged at $27,700. A breakthrough could propel the price towards $28,000.
If the price relinquishes the current $26,800 support level, the next one is between $26,000 and $26,300.
Bitcoin's price trajectory has been bullish over the past week, and I believe there's potential for more upward movement, aiming to challenge higher resistance levels.
Sign-up and trade on Bybit today.
Exclusive $30,000 deposit rewards and bonuses up for grabs!
Chart #2 - Cosmos (ATOMUSDT) Daily Chart
Chartist: Kyle
(For the chart screenshot, click here.)
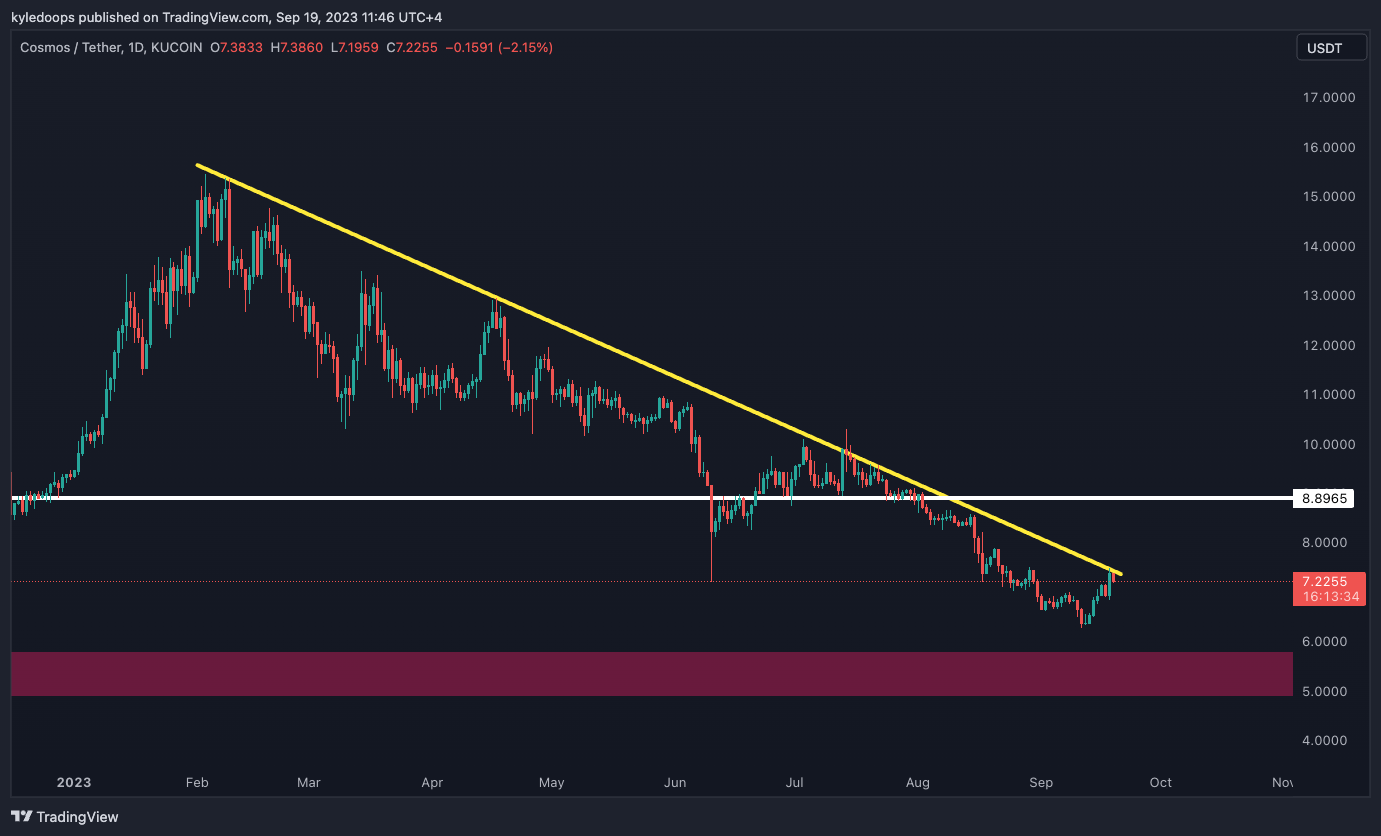
ATOM is coming directly into the downsloping trend line and open interest has picked up massively, which means market participants may be attempting to break this trend line!
If they do, expect an explosive move up initially and into the $8.89 resistance, at which point I would fade it.
Major support can be found between $5 - $6.
Claim your Bitget sign-up bonuses here (details below).
Chart #3 - Oil (WTI) Daily Chart
Chartist: Kyle
(For the chart screenshot, click here.)
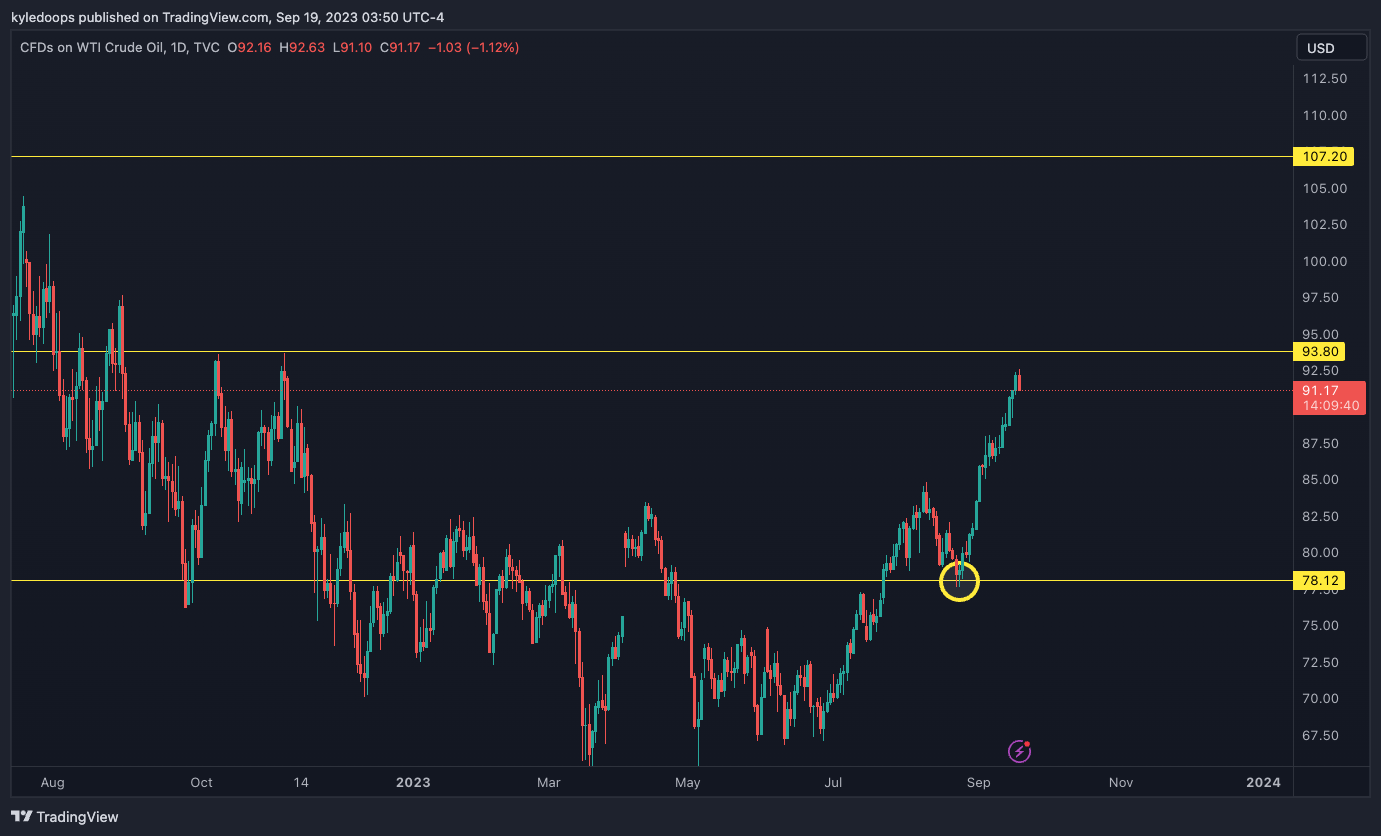
Key levels can be found at $78.12 where price bounced, then $93.80 with major resistance, and then $107.2 with range high resistance.
So long as oil goes up, the interest rate hikes will likely continue in the future as inflation becomes tough to control.
And that likely has an effect on the Fed's decisions in the future.
Claim your Bitget sign-up bonuses here (details below).
Chart #4 - Solana (SOLUSDT) Daily Chart
Chartist: Sheldon
(For the chart screenshot, click here.)
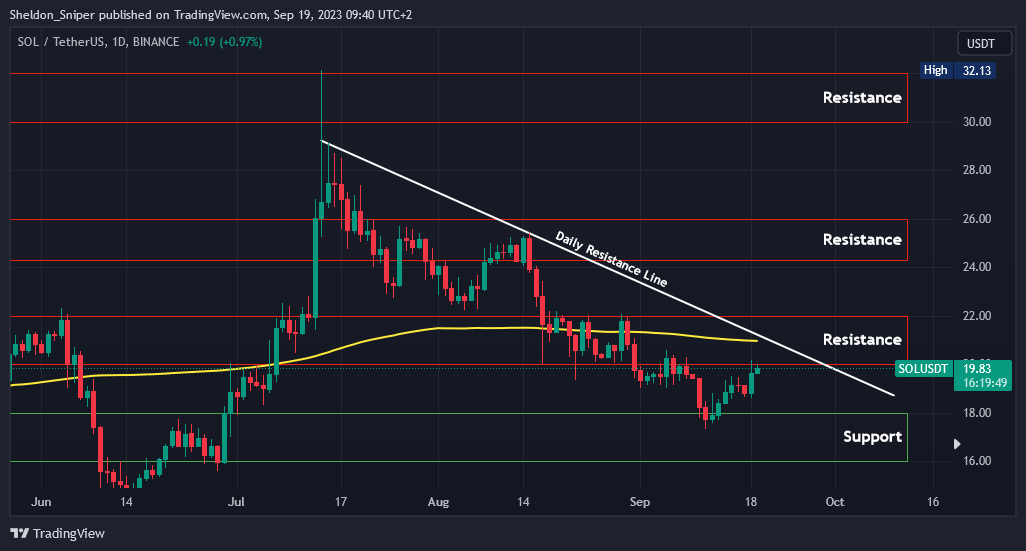
SOL has reached the $19.90 resistance level where it could consolidate for a few days before testing $21.00.
$21.00 will be challenging to surpass, but if it does break through, the subsequent resistance stands at the range high of $22.00.
If it faces rejection at $19.90, the ensuing support begins at $18.00.
Claim your Bitget sign-up bonuses here (details below).
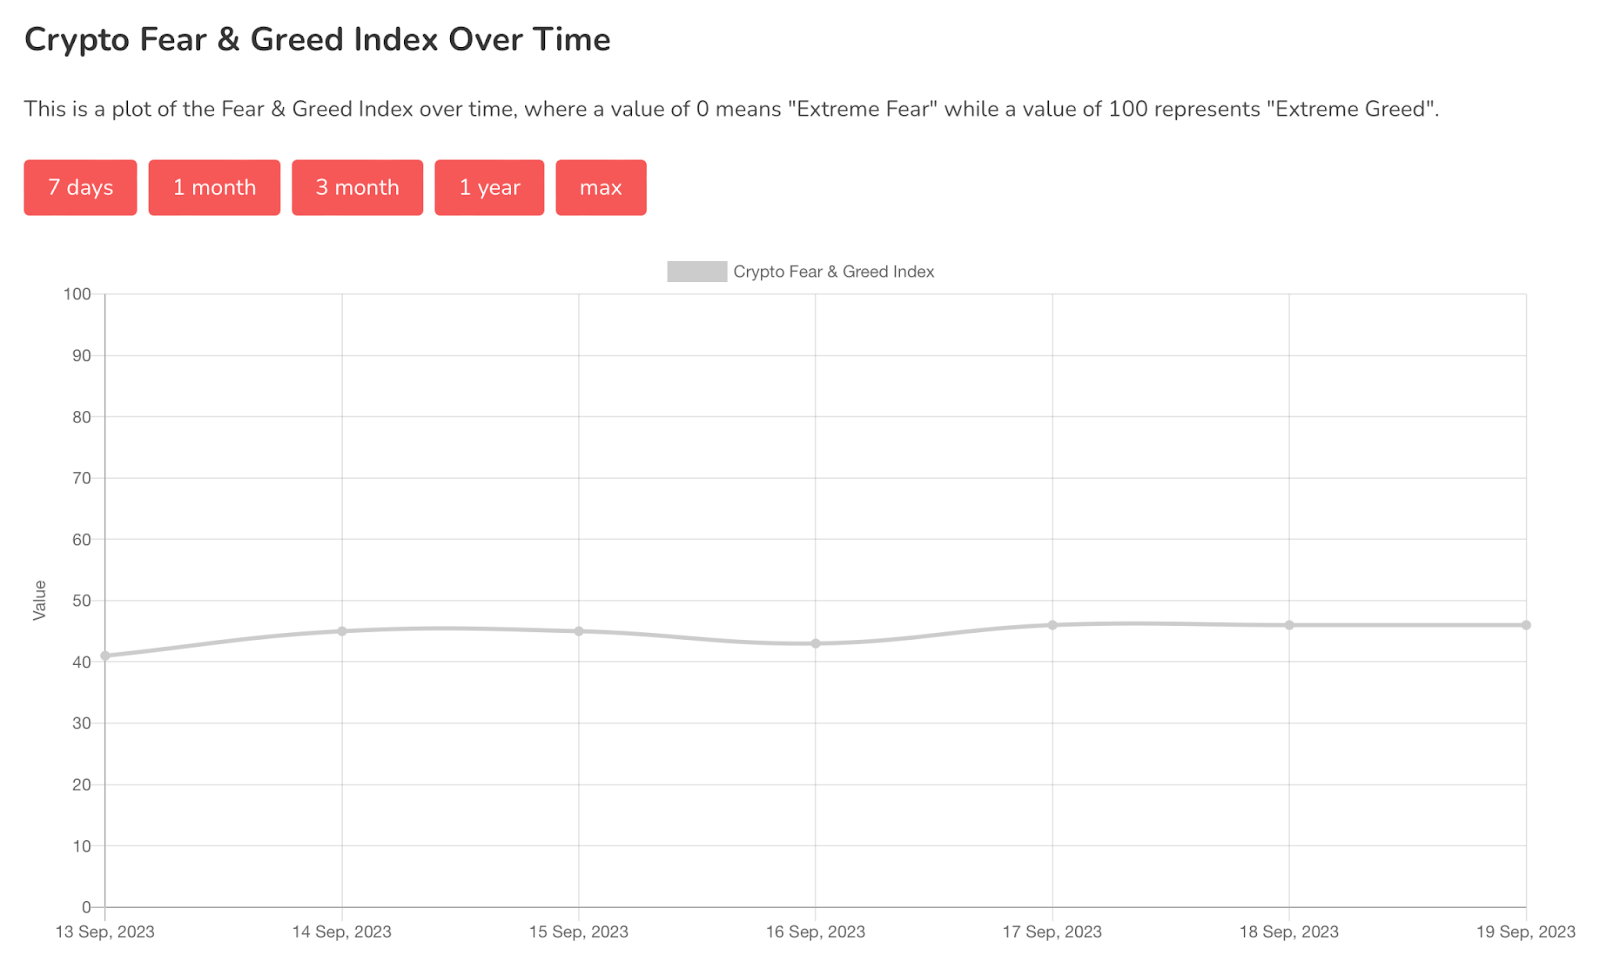
Chart #5 - Fear and Greed Index
The Fear and Greed Index is sitting at 46 today, indicating Fear.
The highest the index has been over the past seven days is 46, and the lowest is 41.
Banter’s Take
The market will likely see some major volatility going into tomorrow's FOMC meeting.
Currently the market is pricing in that there will be no interest rate hike. If there are any surprises the market will crash.
Stay safe my friends!
Go to our Crypto Banter Discord here where Sheldon and Kyle give updates on the charts and trades from The Daily Candle newsletter!