

📈📉 Extreme volatility absolutely guaranteed! This is our next trade!
📈📉 Extreme volatility absolutely guaranteed! This is our next trade!

Bitget winner - 2496999612
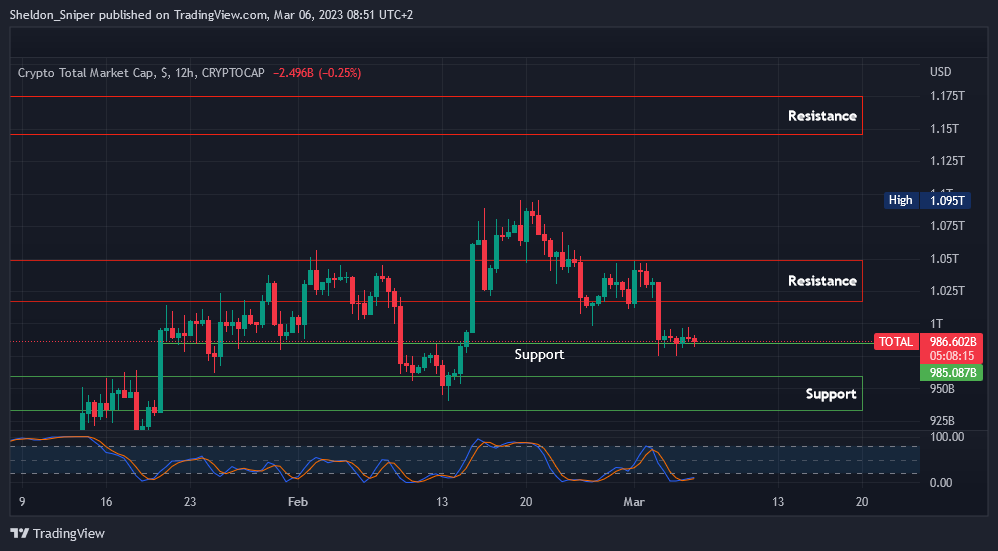
Chart #1 - TOTAL 12-Hour Chart
Chartist: Sheldon
(For the chart screenshot, click here.)
On Friday, the Total Crypto Market Cap lost its $1T - $1.02T support, dropping to $985B - possibly due to concerns of Mt Gox bitcoin starting to enter the market on the 10th of March and potentially causing a massive sell-off as creditors look to take profits on assets they most likely thought had been lost forever.
The market has been moving sideways for three days now, with no clear direction as to where the TOTAL really wants to head.
If it drops, the next significant area of support is around $950B - a level that held as support in mid-February. But if the TOTAL moves up, it could retest the previous support at $1T - $1.02T, which will now act as resistance. I suspect sideways action might continue until the 10th of March due to all the uncertainty in the market. Check out today's issue of Good Morning Crypto here to see what I mean.
Check our Crypto Banter Discord here for updates!
Follow me on Twitter for urgent updates on my trading progress!
Claim your Bitget sign-up bonuses here (details below).
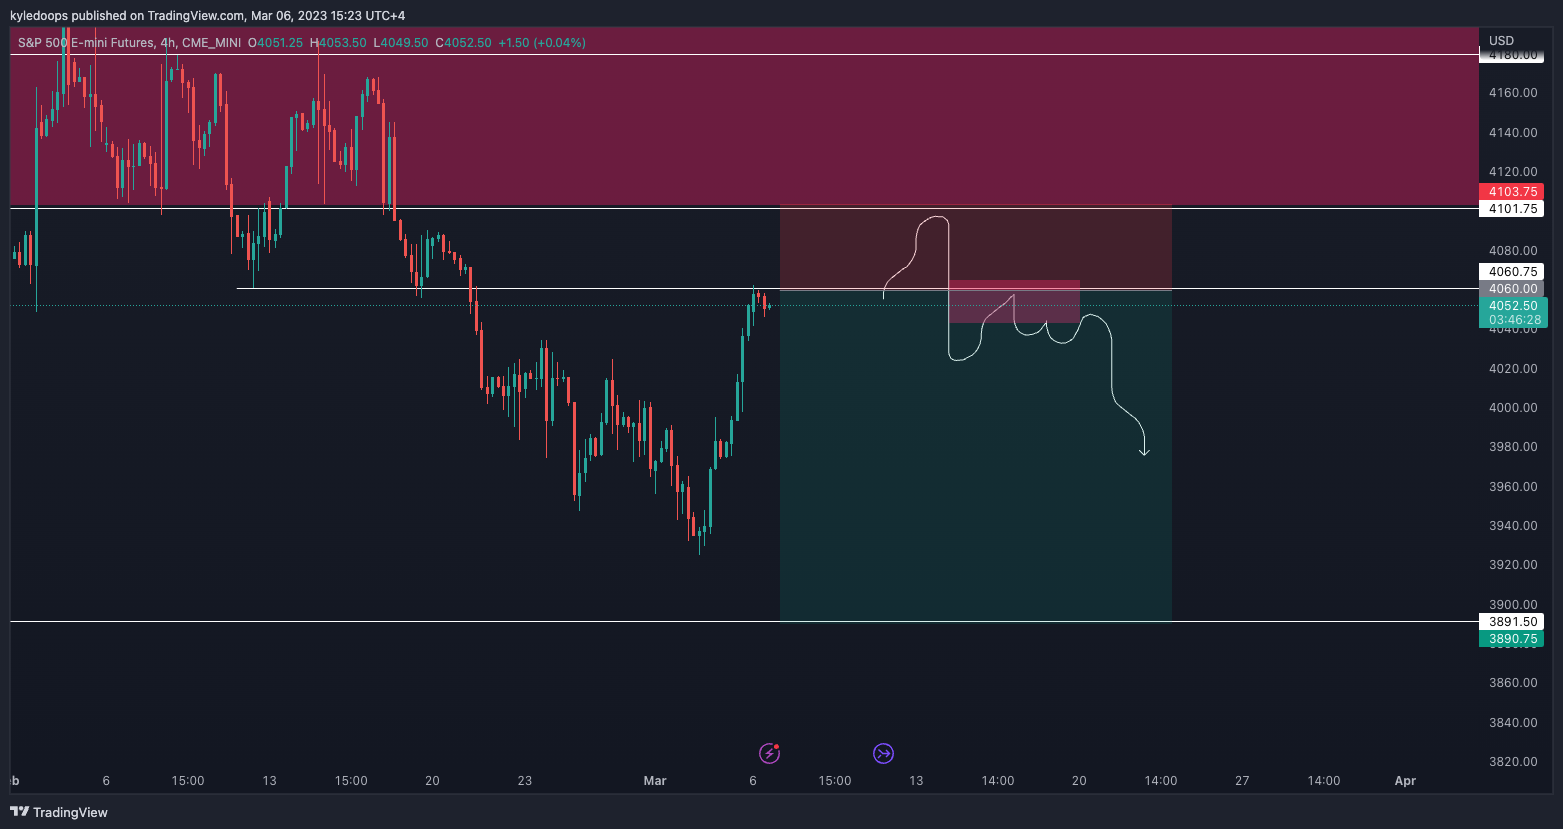
Chart #2 - S&P 500 (ES1!) 4-Hour Chart
Chartist: Kyle
(For the chart screenshot, click here.)
The ES1! is heading into key resistance.
I suspect we'll see a deviation take place, and that would present us with a great opportunity to go short.
Our main target would be a sweep of liquidity, so essentially 3,891.50.
And our stop loss would be placed at 4,101.75.
Check our Crypto Banter Discord here for updates!
Make sure to follow me on Twitter, where I will post updates on my trades as they unfold!
Claim your Bitget sign-up bonuses here (details below).
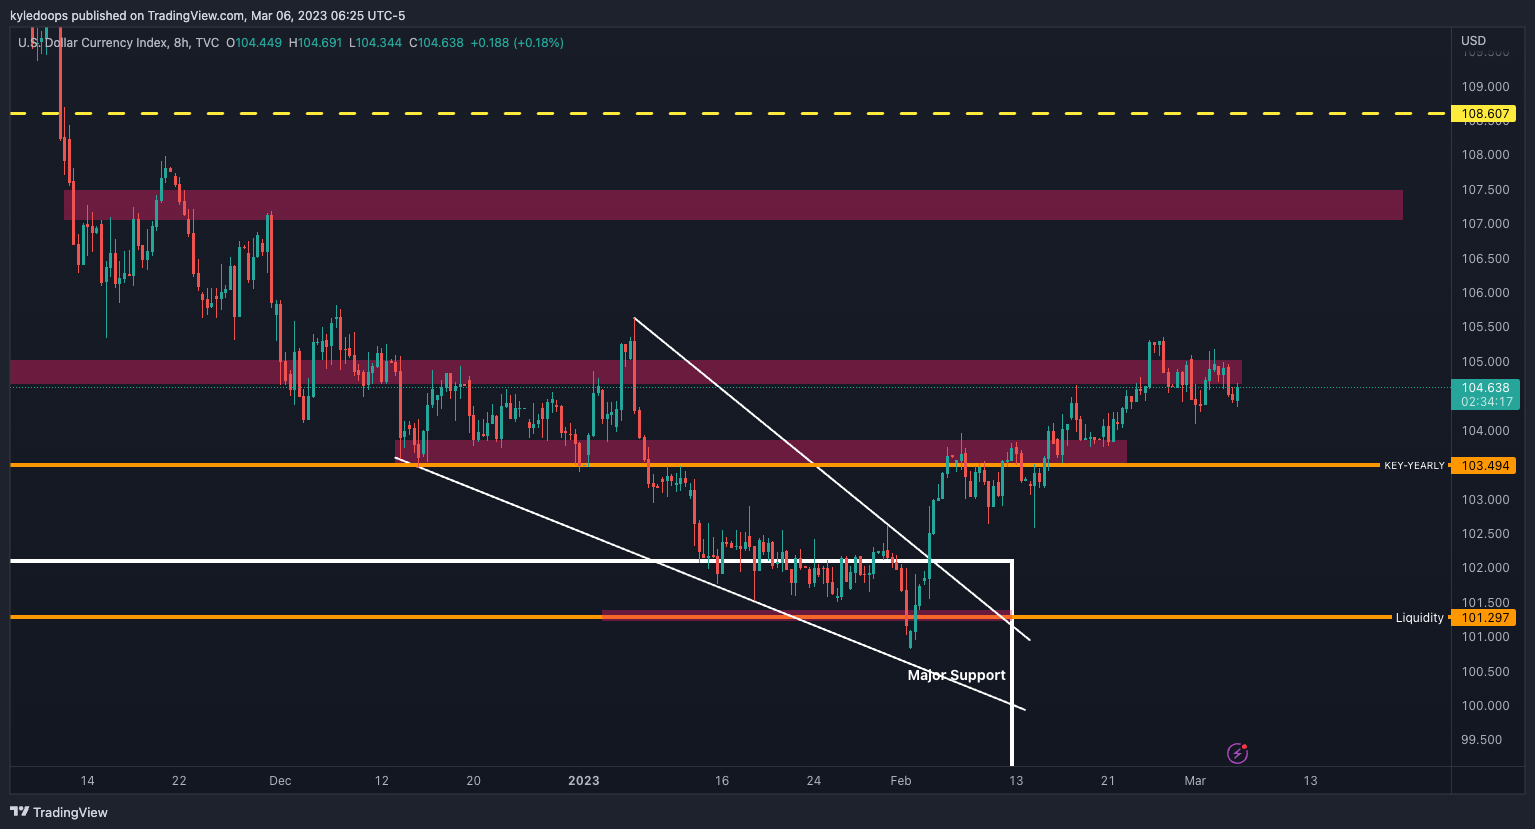
Chart #3 - DXY 8-Hour Chart
Chartist: Kyle
(For the chart screenshot, click here.)
The dollar is making its way back into the pink box, as seen on the chart.
A reclaim of that level would have it push up towards 107, which would mean the stock market would likely pull back, taking crypto down with it.
107.5 would be my main upside target on the DXY, and I would be looking for a high timeframe lower high to get set. That should coincide with bitcoin's range low at $18,000, should it revisit it.
Check our Crypto Banter Discord here for updates!
Make sure to follow me on Twitter, where I will post updates on my trades as they unfold!
Claim your Bitget sign-up bonuses here (details below).
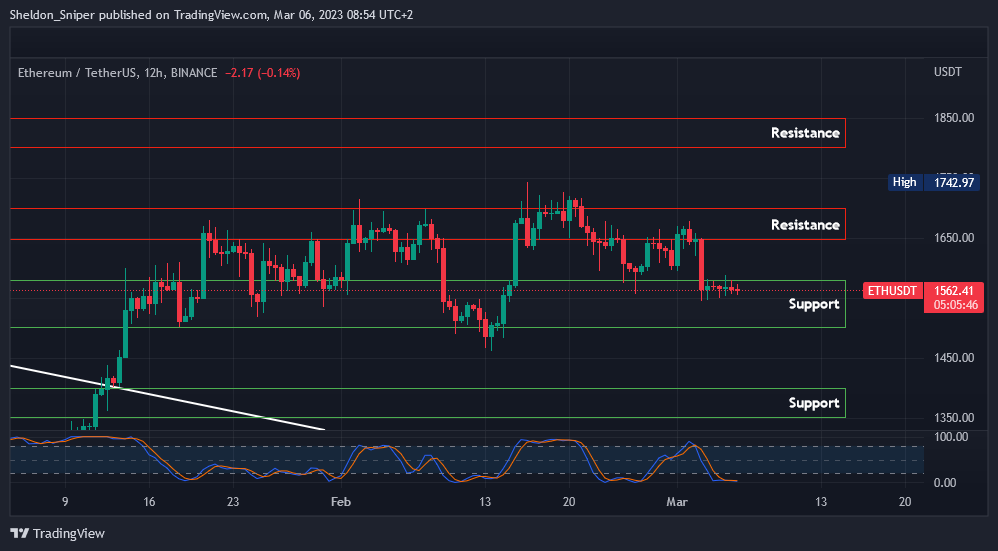
Chart #4 - Ethereum (ETHUSDT) 12-Hour Chart
Chartist: Sheldon
(For the chart screenshot, click here.)
On Friday, ETH fell with the rest of the market, going from $1,650 (resistance) all the way down to support at $1,550. ETH has been trading sideways since, and with uncertainty in the market, it could continue consolidating here for a little while longer.
The next area of resistance for ETH sits at $1,600 - $1,650. And the next support area from here, if ETH loses the $1,500 - $1,550 zone, is between $1,350 - $1,400.
Unfortunately, it is now a waiting game to see how the market reacts to the Mt Gox bitcoin entering the market. So we'll analyze ETH level by level, one step at a time.
Check our Crypto Banter Discord here for updates!
Follow me on Twitter to get all the updates on my personal trading progress!
Claim your Bitget sign-up bonuses here (details below).
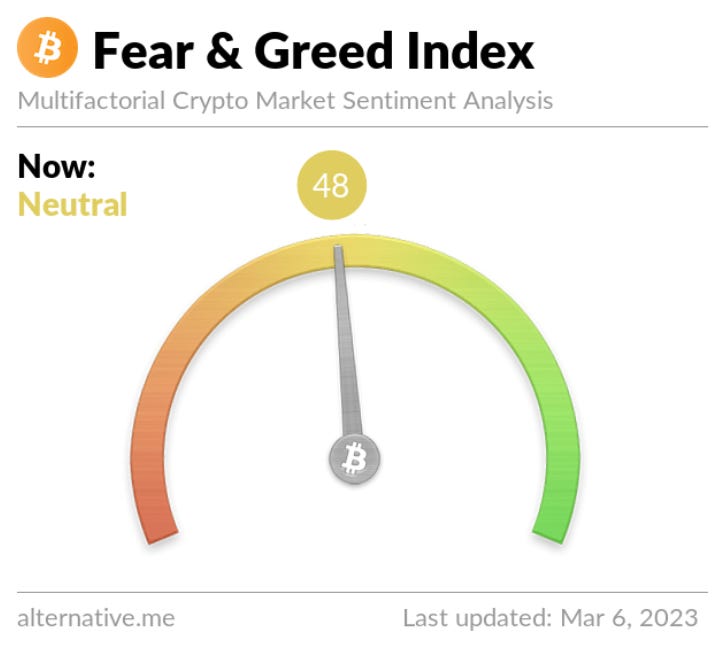
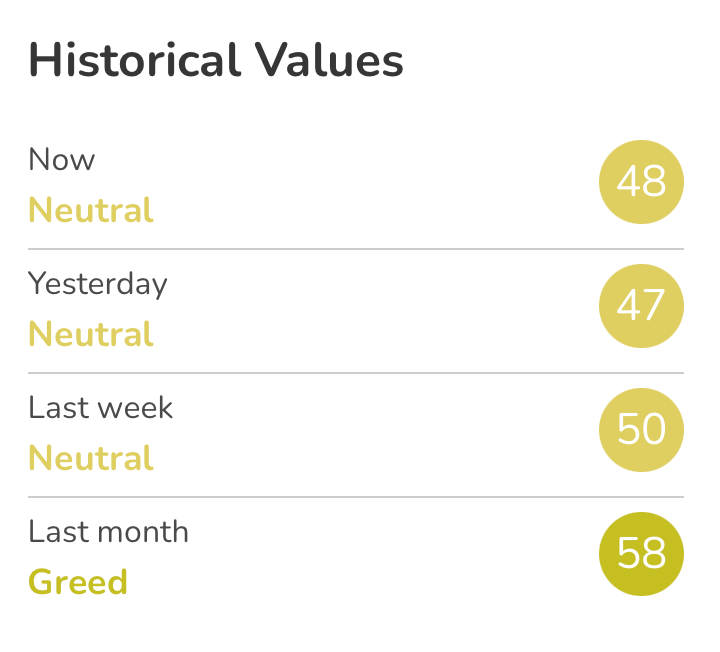
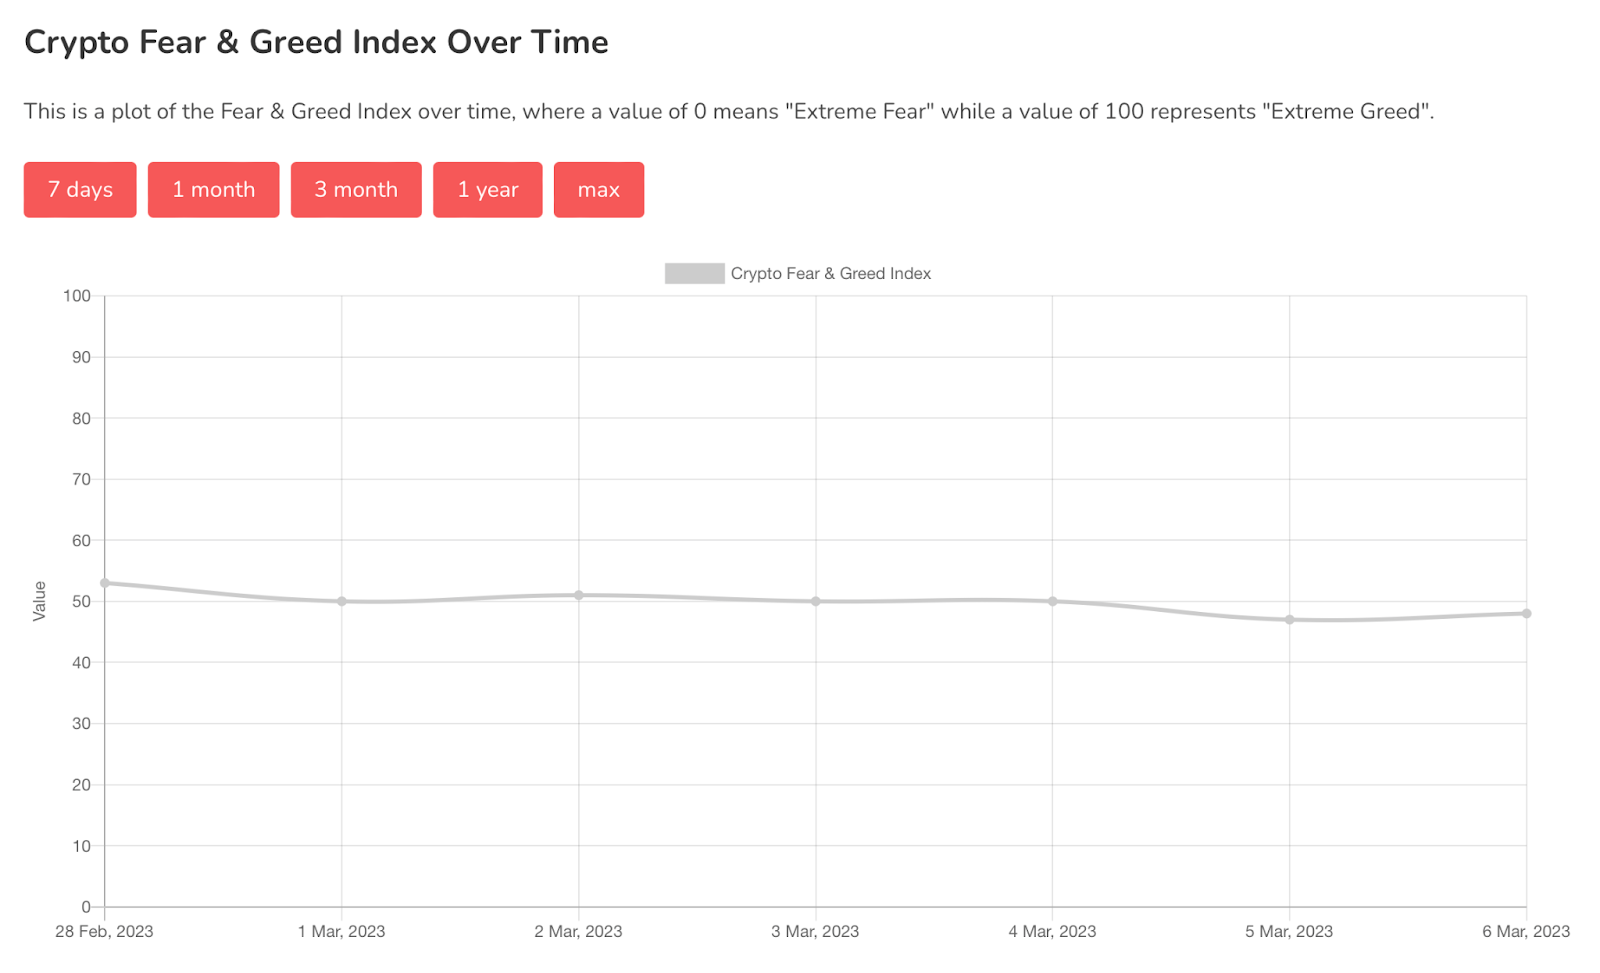
Chart #5 - Bitcoin Fear and Greed Index
The Bitcoin Fear and Greed Index is sitting at 48 today, Neutral.
The highest the index has been over the past seven days is 53, and the lowest is 47.
Overall Market Sentiment (Banter’s Take)
Currently, the risk-on markets look to be under heavy pressure, with major risk to the downside. Both bulls and bears will probably make their next move in the next 24 - 48 hours. High volatility is absolutely guaranteed this week with all the major economic events lined up from the FED.
Stay safe my friends!
Bybit winner - 26963612
Thank you for your content! It's really helpful :)